TOULOUSE_MF


Location

lon / lat [deg]: 1.3743 / 43.5726

Source network: AERONET


Geostationary surface albedo (GSA) data


“+000”


“+057/+063”


Landcover information (based on ESA CCI landcover data)


Landcover fractions @ 2km distance


Landcover fractions @ 20 km distance


Legend


Distance to open water bodies [km]:

0.74

Distance to urban areas [km]:

0.13


Radius: 1 km

Number of landcover classes:

3

Dominant landcover type:

190: urban areas

Fraction of dominant landcover type [%]:

62.0


Radius: 2 km

Number of landcover classes:

3

Dominant landcover type:

190: urban areas

Fraction of dominant landcover type [%]:

83.0


Radius: 5 km

Number of landcover classes:

3

Dominant landcover type:

190: urban areas

Fraction of dominant landcover type [%]:

88.0


Radius: 10 km

Number of landcover classes:

3

Dominant landcover type:

190: urban areas

Fraction of dominant landcover type [%]:

69.0


Radius: 20 km

Number of landcover classes:

3

Dominant landcover type:

10: cropland, rainfed

Fraction of dominant landcover type [%]:

63.0


Disturbances


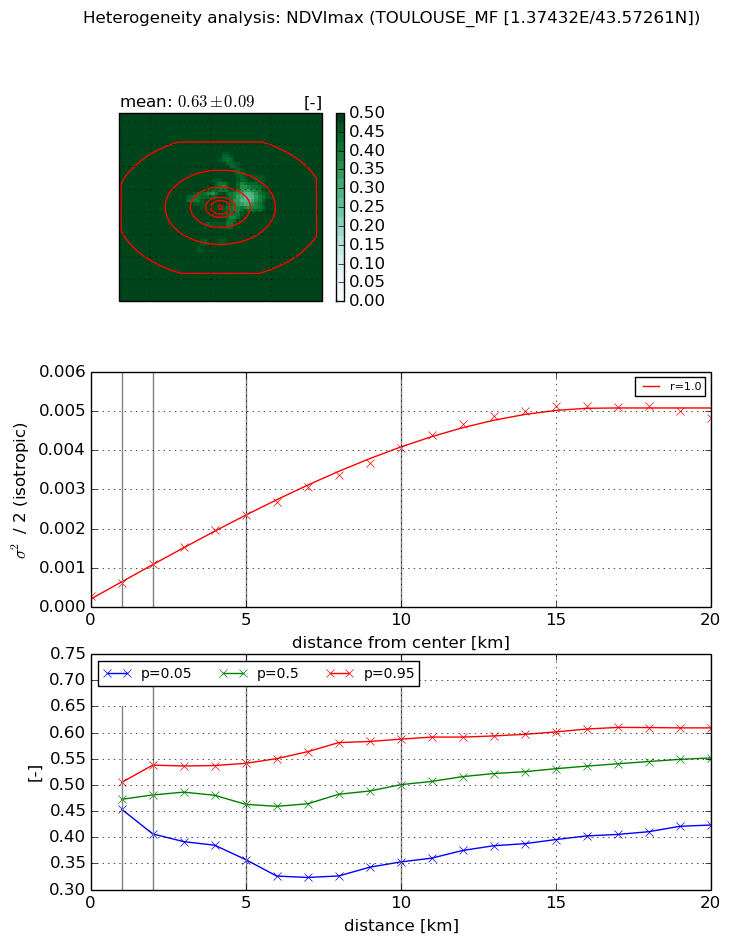
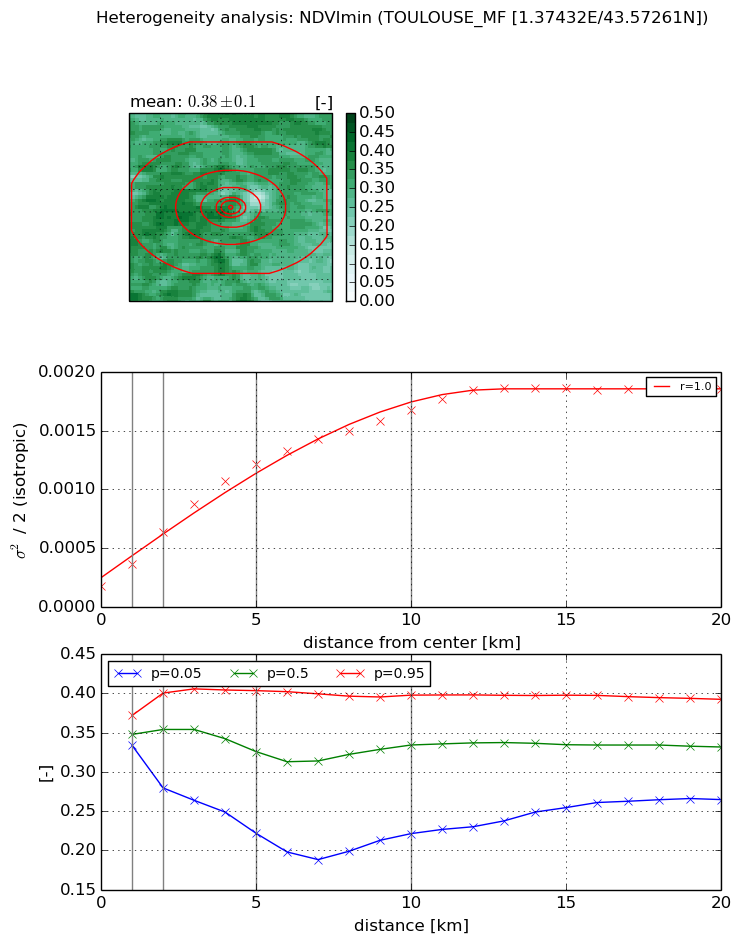
Heterogeneity analysis

The heterogeneity analysis provides information about the spatial and temporal heterogeneity of the site.

Topography


Roman et al. (2009) index


St

0.00459087101426

Rcv

0.834076889464

Rse

0.0

Rst

1.92068141457e-07

Rsv

652.63668929


Height range @ 1km [m]

6

Height range @ 2km [m]

10

Height range @ 5km [m]

30

Height range @ 10km [m]

-999

Height range @ 20km [m]

-999


Variance slope @ 1 km

39

Variance slope @ 2 km

31

Variance slope @ 5 km

23

Variance slope @ 10 km

-999

Variance slope @ 20 km

-999


NDVI (max. NDVI composite)


Roman et al. (2009) index


St

1.57519548409e-07

Rcv

0.277322764995

Rse

0.0

Rst

0.146306887627

Rsv

19045254.7863


NDVI range @ 1km [-]

0.05

NDVI range @ 2km [-]

0.13

NDVI range @ 5km [-]

0.18

NDVI range @ 10km [-]

0.23

NDVI range @ 20km [-]

0.19


Variance slope @ 1 km

0.000326477006315

Variance slope @ 2 km

0.000400727322714

Variance slope @ 5 km

0.000421091804509

Variance slope @ 10 km

0.000379309915393

Variance slope @ 20 km

0.000250977258533


NDVI (min. NDVI composite)I


Roman et al. (2009) index


St

1.63798237404e-07

Rcv

0.399929636691

Rse

0.0

Rst

0.168415350784

Rsv

18315214.8304


NDVI range @ 1km [-]

0.04

NDVI range @ 2km [-]

0.12

NDVI range @ 5km [-]

0.18

NDVI range @ 10km [-]

0.18

NDVI range @ 20km [-]

0.13


NDVI slope @ 1 km

0.000194730456718

NDVI slope @ 2 km

0.000230641001633

NDVI slope @ 5 km

0.000216047534013

NDVI slope @ 10 km

0.000148113278006

NDVI slope @ 20 km

7.73455169094e-05


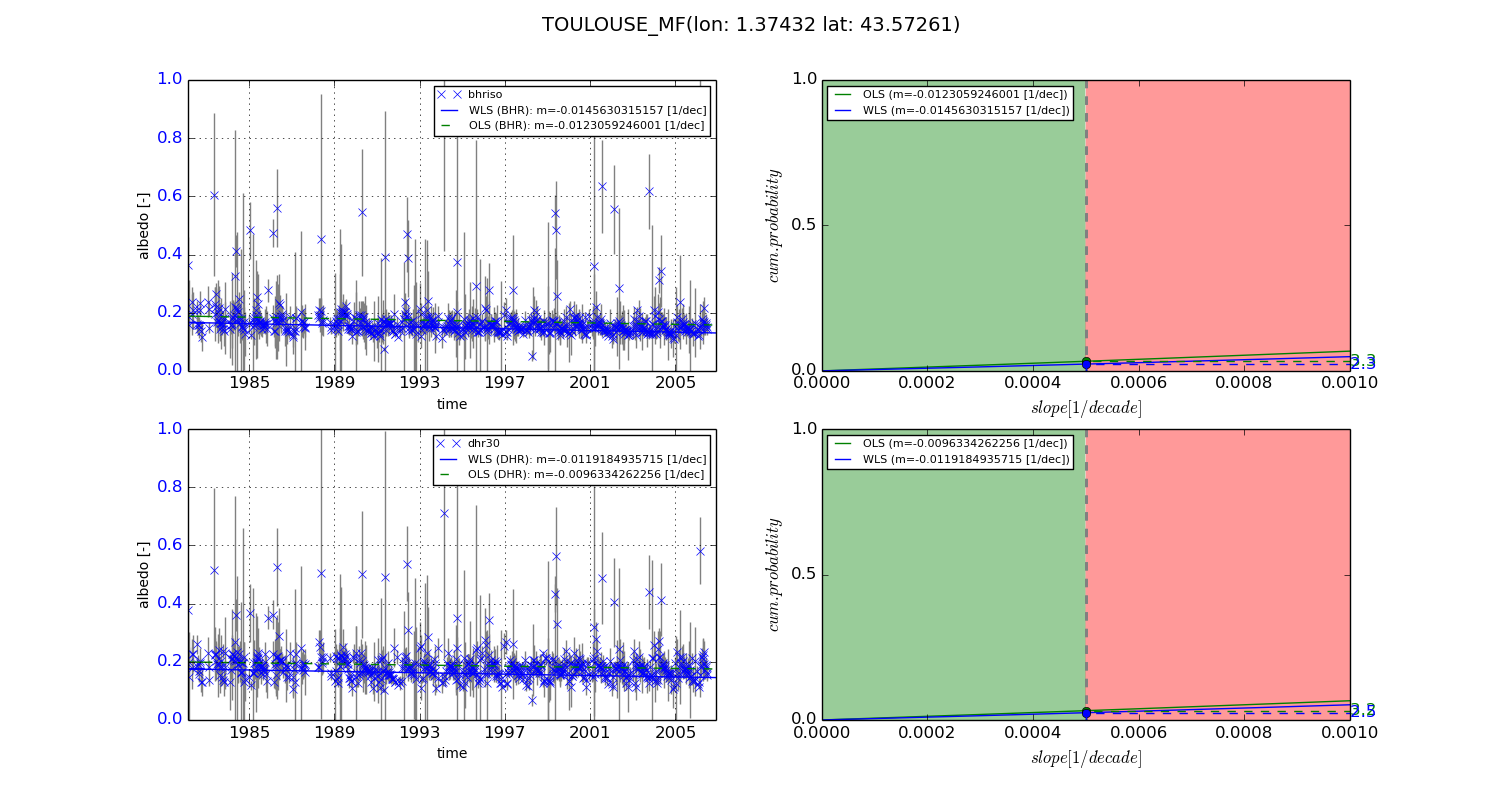
Temporal stability analysis

+000 deg (BHR)


BHR statistics

Temporal stability [1/decade]:


abs

rel


Weighted least square:

-0.0145630315157


Ordinary least square:

-0.0123059246001


Probabilities that GCOS criteria is met:

Weighted least square:

2.3 %

Ordinary least square:

3.3 %


DHR statistics

Temporal stability [1/decade]:


abs

rel


Weighted least square:

-0.0119184935715


Ordinary least square:

-0.0096334262256


Probabilities that GCOS criteria is met:

Weighted least square:

2.5 %

Ordinary least square:

3.2 %


+057/+063 deg (BHR)


BHR statistics

Temporal stability [1/decade]:


abs

rel


Weighted least square:

-99999.0


Ordinary least square:

-99999.0


Probabilities that GCOS criteria is met:

Weighted least square:

-99999.0 %

Ordinary least square:

-99999.0 %


DHR statistics

Temporal stability [1/decade]:


abs

rel


Weighted least square:

-99999.0


Ordinary least square:

-99999.0


Probabilities that GCOS criteria is met:

Weighted least square:

-99999.0 %

Ordinary least square:

-99999.0 %


Temporal anomaly analyis

The variance of the temporal anomalies provides an additional measure about the stability of the signal AFTER removal of the mean seasonal cylce.
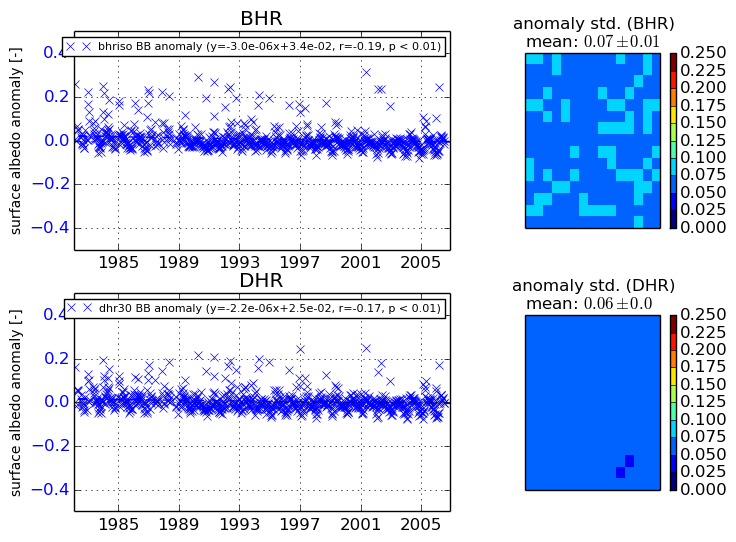
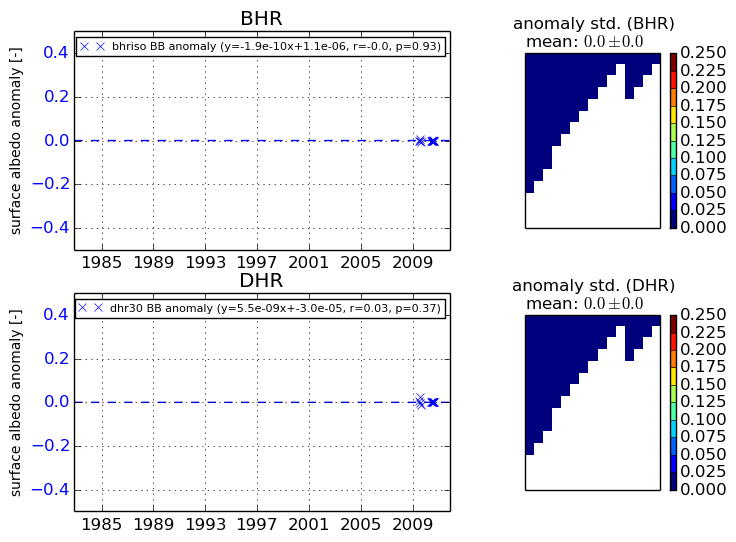
+000 deg


+057/+063 deg