TUXTLA_GUTIERREZ


Location

lon / lat [deg]: -93.1522 / 16.7547

Source network: AERONET


Geostationary surface albedo (GSA) data


“+000”


“+057/+063”


Landcover information (based on ESA CCI landcover data)


Landcover fractions @ 2km distance


Landcover fractions @ 20 km distance


Legend


Distance to open water bodies [km]:

11.13

Distance to urban areas [km]:

0.11


Radius: 1 km

Number of landcover classes:

1

Dominant landcover type:

190: urban areas

Fraction of dominant landcover type [%]:

100.0


Radius: 2 km

Number of landcover classes:

3

Dominant landcover type:

190: urban areas

Fraction of dominant landcover type [%]:

93.0


Radius: 5 km

Number of landcover classes:

7

Dominant landcover type:

190: urban areas

Fraction of dominant landcover type [%]:

53.0


Radius: 10 km

Number of landcover classes:

7

Dominant landcover type:

190: urban areas

Fraction of dominant landcover type [%]:

24.0


Radius: 20 km

Number of landcover classes:

8

Dominant landcover type:

130: grassland

Fraction of dominant landcover type [%]:

27.0


Disturbances


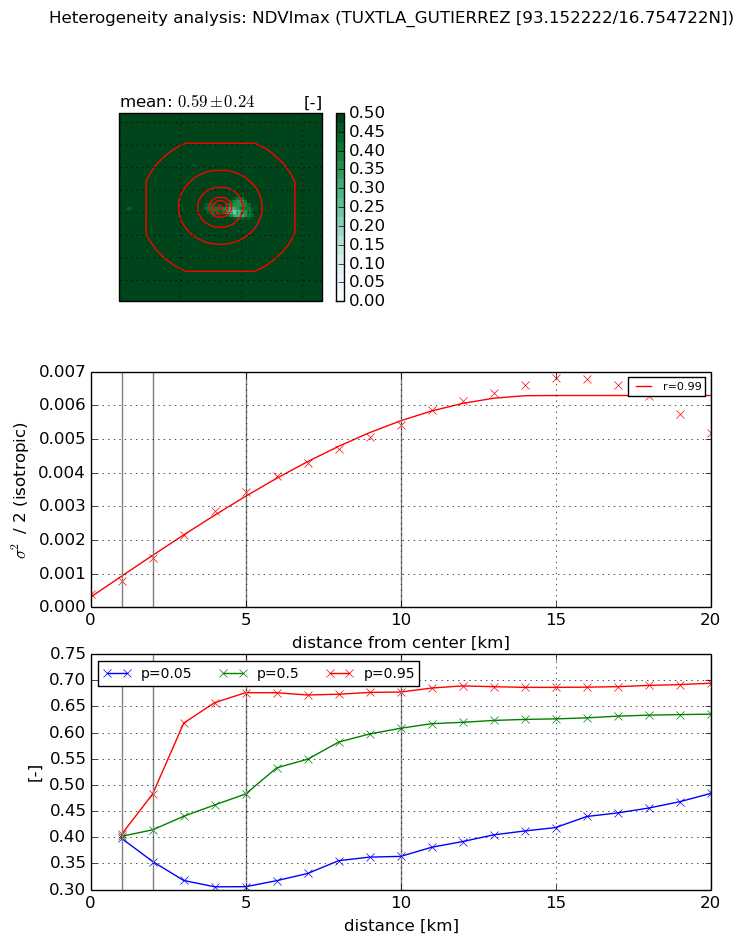
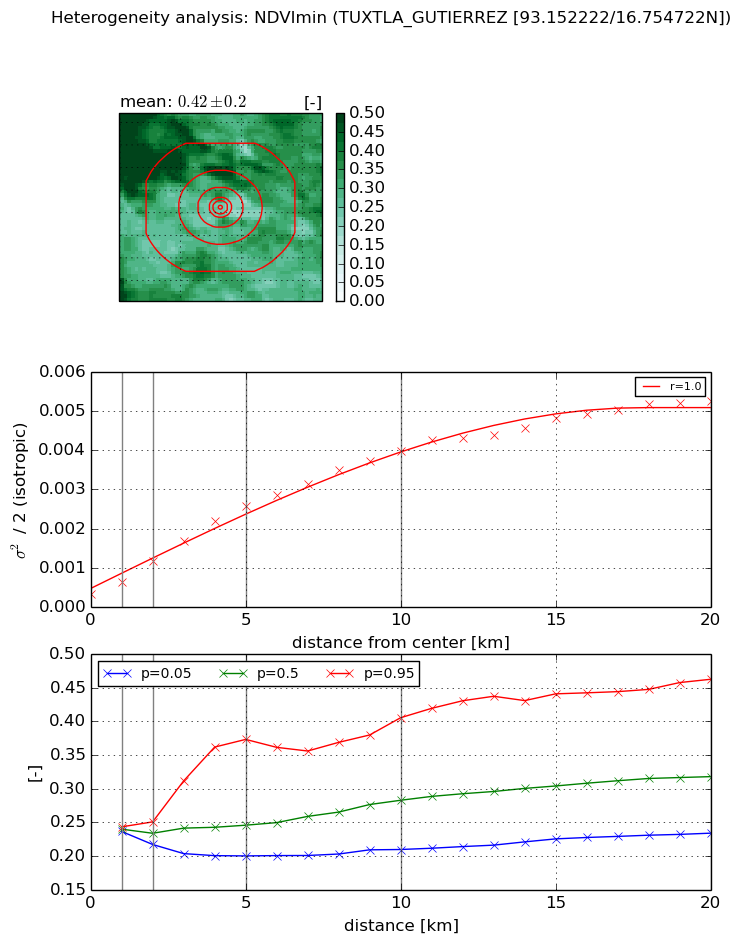
Heterogeneity analysis

The heterogeneity analysis provides information about the spatial and temporal heterogeneity of the site.

Topography


Roman et al. (2009) index


St

2.84452322132

Rcv

0.43471336212

Rse

0.0

Rst

-0.0100003472536

Rsv

0.609944581869


Height range @ 1km [m]

53

Height range @ 2km [m]

132

Height range @ 5km [m]

405

Height range @ 10km [m]

-999

Height range @ 20km [m]

-999


Variance slope @ 1 km

3108

Variance slope @ 2 km

4581

Variance slope @ 5 km

5231

Variance slope @ 10 km

-999

Variance slope @ 20 km

-999


NDVI (max. NDVI composite)


Roman et al. (2009) index


St

13.0767769395

Rcv

0.135157864552

Rse

0.0

Rst

0.00460977686913

Rsv

-0.0896466870398


NDVI range @ 1km [-]

0.01

NDVI range @ 2km [-]

0.13

NDVI range @ 5km [-]

0.37

NDVI range @ 10km [-]

0.31

NDVI range @ 20km [-]

0.21


Variance slope @ 1 km

0.000377654361549

Variance slope @ 2 km

0.000530675509608

Variance slope @ 5 km

0.000629328703685

Variance slope @ 10 km

0.000520487859327

Variance slope @ 20 km

0.00029008737952


NDVI (min. NDVI composite)I


Roman et al. (2009) index


St

4.98303510315e-07

Rcv

0.356690489907

Rse

0.0

Rst

0.437943261868

Rsv

6020426.3906


NDVI range @ 1km [-]

0.01

NDVI range @ 2km [-]

0.03

NDVI range @ 5km [-]

0.17

NDVI range @ 10km [-]

0.2

NDVI range @ 20km [-]

0.23


NDVI slope @ 1 km

0.00031054290188

NDVI slope @ 2 km

0.000427956850957

NDVI slope @ 5 km

0.000469184779339

NDVI slope @ 10 km

0.00037400361765

NDVI slope @ 20 km

0.000241553787697


Temporal stability analysis

+000 deg (BHR)


BHR statistics

Temporal stability [1/decade]:


abs

rel


Weighted least square:

None


Ordinary least square:

None


Probabilities that GCOS criteria is met:

Weighted least square:

None %

Ordinary least square:

None %


DHR statistics

Temporal stability [1/decade]:


abs

rel


Weighted least square:

None


Ordinary least square:

None


Probabilities that GCOS criteria is met:

Weighted least square:

None %

Ordinary least square:

None %


+057/+063 deg (BHR)


BHR statistics

Temporal stability [1/decade]:


abs

rel


Weighted least square:

None


Ordinary least square:

None


Probabilities that GCOS criteria is met:

Weighted least square:

None %

Ordinary least square:

None %


DHR statistics

Temporal stability [1/decade]:


abs

rel


Weighted least square:

None


Ordinary least square:

None


Probabilities that GCOS criteria is met:

Weighted least square:

None %

Ordinary least square:

None %


Temporal anomaly analyis

The variance of the temporal anomalies provides an additional measure about the stability of the signal AFTER removal of the mean seasonal cylce.

+000 deg


+057/+063 deg