UBON_RATCHATHANI


Location

lon / lat [deg]: 104.871 / 15.2455

Source network: AERONET


Geostationary surface albedo (GSA) data


“+000”


“+057/+063”


Landcover information (based on ESA CCI landcover data)


Landcover fractions @ 2km distance


Landcover fractions @ 20 km distance


Legend


Distance to open water bodies [km]:

0.88

Distance to urban areas [km]:

0.04


Radius: 1 km

Number of landcover classes:

2

Dominant landcover type:

190: urban areas

Fraction of dominant landcover type [%]:

94.0


Radius: 2 km

Number of landcover classes:

3

Dominant landcover type:

190: urban areas

Fraction of dominant landcover type [%]:

96.0


Radius: 5 km

Number of landcover classes:

7

Dominant landcover type:

190: urban areas

Fraction of dominant landcover type [%]:

60.0


Radius: 10 km

Number of landcover classes:

7

Dominant landcover type:

10: cropland, rainfed

Fraction of dominant landcover type [%]:

60.0


Radius: 20 km

Number of landcover classes:

7

Dominant landcover type:

10: cropland, rainfed

Fraction of dominant landcover type [%]:

75.0


Disturbances


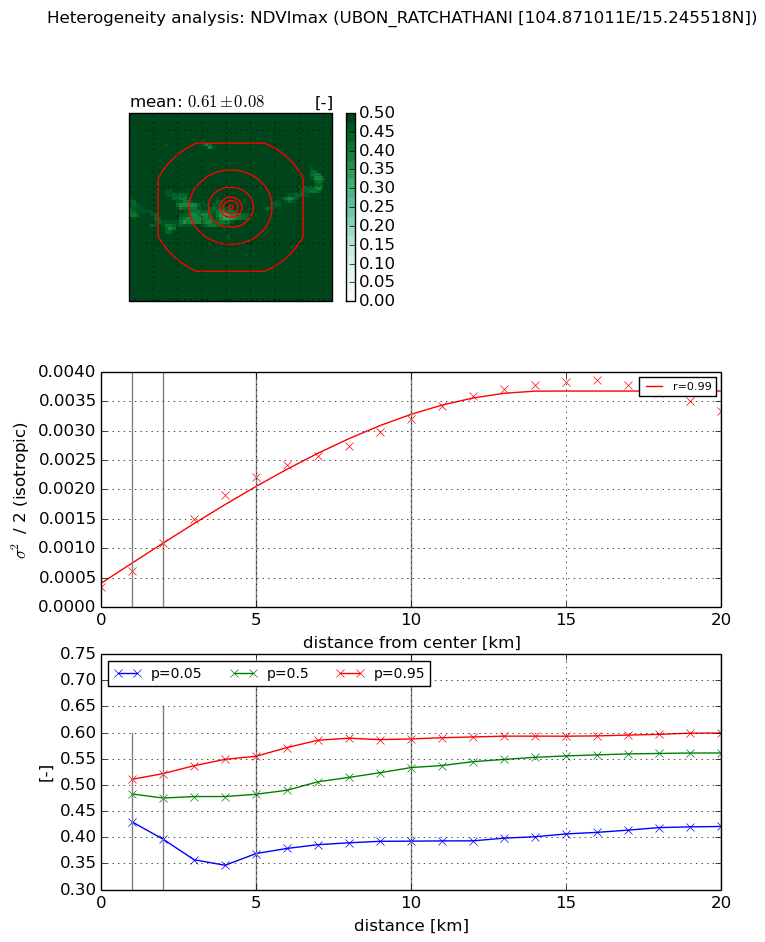
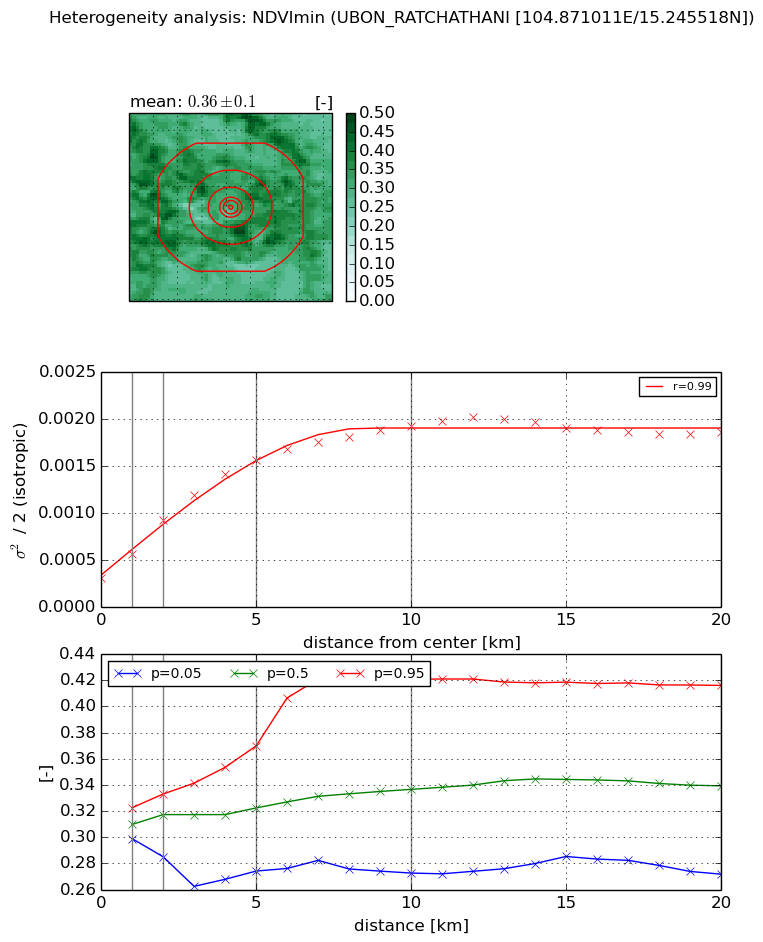
Heterogeneity analysis

The heterogeneity analysis provides information about the spatial and temporal heterogeneity of the site.

Topography


Roman et al. (2009) index


St

2.41893655497e-06

Rcv

0.226326021757

Rse

0.0

Rst

-0.166472958896

Rsv

1240214.02863


Height range @ 1km [m]

10

Height range @ 2km [m]

14

Height range @ 5km [m]

19

Height range @ 10km [m]

-999

Height range @ 20km [m]

-999


Variance slope @ 1 km

19

Variance slope @ 2 km

16

Variance slope @ 5 km

8

Variance slope @ 10 km

-999

Variance slope @ 20 km

-999


NDVI (max. NDVI composite)


Roman et al. (2009) index


St

1.36407734395e-06

Rcv

-0.0163019339374

Rse

0.0

Rst

0.304654773238

Rsv

2199288.4608


NDVI range @ 1km [-]

0.08

NDVI range @ 2km [-]

0.13

NDVI range @ 5km [-]

0.19

NDVI range @ 10km [-]

0.2

NDVI range @ 20km [-]

0.18


Variance slope @ 1 km

0.000284171913902

Variance slope @ 2 km

0.000381878102912

Variance slope @ 5 km

0.000390479470869

Variance slope @ 10 km

0.000284100150792

Variance slope @ 20 km

0.000159807307875


NDVI (min. NDVI composite)I


Roman et al. (2009) index


St

2.2164708174

Rcv

0.095025892612

Rse

0.0

Rst

-0.258477702831

Rsv

-0.99999944933


NDVI range @ 1km [-]

0.02

NDVI range @ 2km [-]

0.05

NDVI range @ 5km [-]

0.1

NDVI range @ 10km [-]

0.15

NDVI range @ 20km [-]

0.14


NDVI slope @ 1 km

0.000246735030158

NDVI slope @ 2 km

0.000305854159148

NDVI slope @ 5 km

0.000259293323905

NDVI slope @ 10 km

0.00015786803287

NDVI slope @ 20 km

5.95982269728e-05


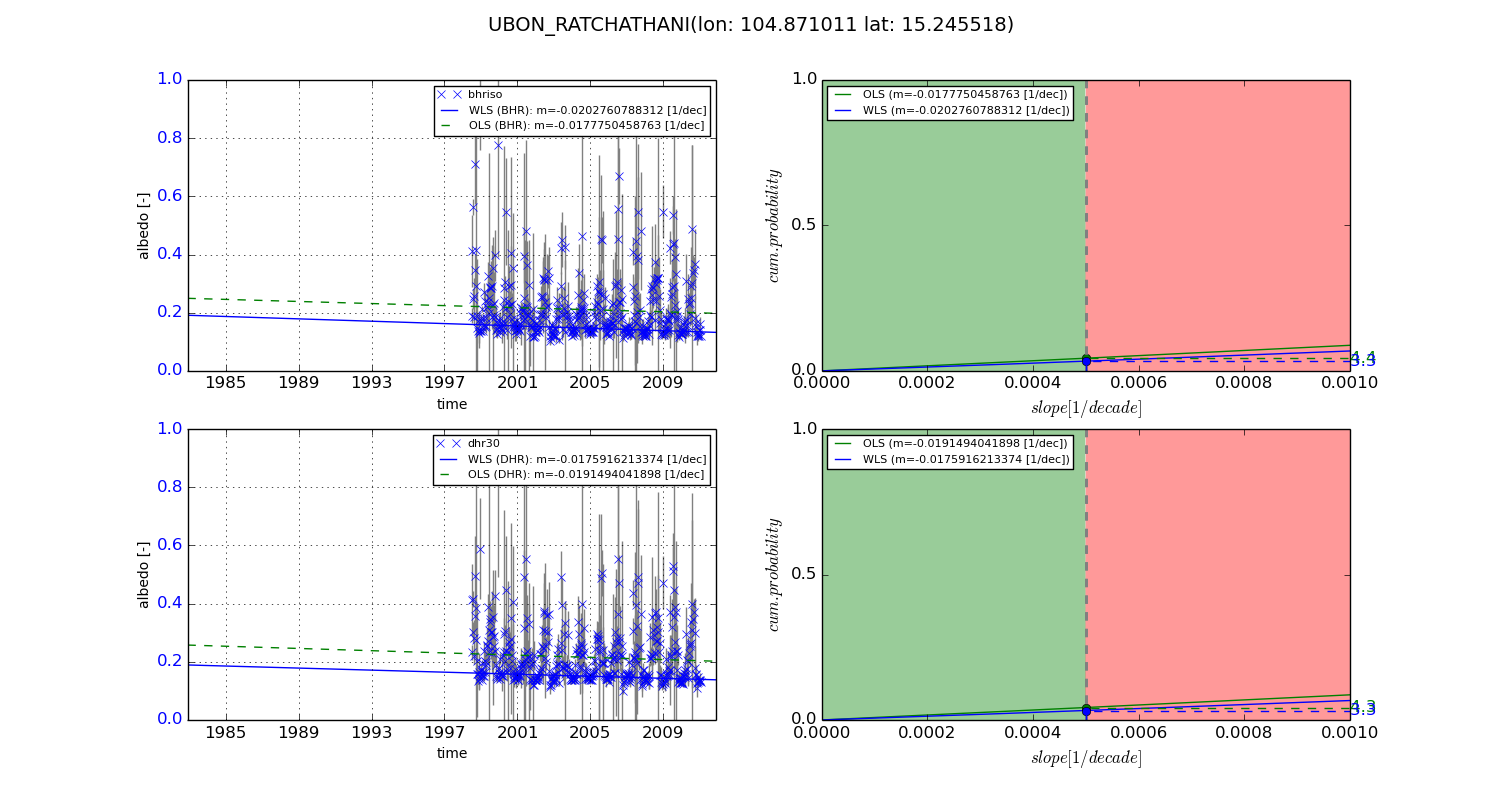
Temporal stability analysis

+000 deg (BHR)


BHR statistics

Temporal stability [1/decade]:


abs

rel


Weighted least square:

None


Ordinary least square:

None


Probabilities that GCOS criteria is met:

Weighted least square:

None %

Ordinary least square:

None %


DHR statistics

Temporal stability [1/decade]:


abs

rel


Weighted least square:

None


Ordinary least square:

None


Probabilities that GCOS criteria is met:

Weighted least square:

None %

Ordinary least square:

None %


+057/+063 deg (BHR)


BHR statistics

Temporal stability [1/decade]:


abs

rel


Weighted least square:

-0.0202760788312


Ordinary least square:

-0.0177750458763


Probabilities that GCOS criteria is met:

Weighted least square:

3.3 %

Ordinary least square:

4.4 %


DHR statistics

Temporal stability [1/decade]:


abs

rel


Weighted least square:

-0.0175916213374


Ordinary least square:

-0.0191494041898


Probabilities that GCOS criteria is met:

Weighted least square:

3.3 %

Ordinary least square:

4.3 %


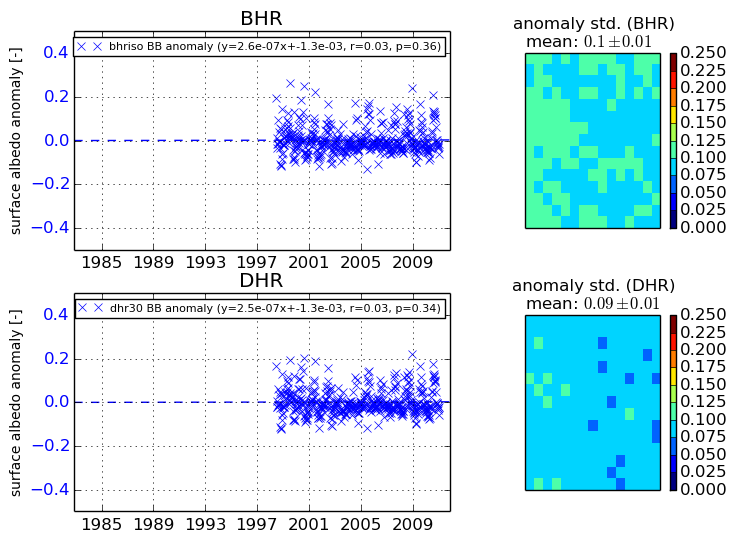
Temporal anomaly analyis

The variance of the temporal anomalies provides an additional measure about the stability of the signal AFTER removal of the mean seasonal cylce.

+000 deg


+057/+063 deg