UK-AMO


Location

lon / lat [deg]: -3.2389 / 55.7917

Source network: FLUXNET


Geostationary surface albedo (GSA) data


“+000”


“+057/+063”


Landcover information (based on ESA CCI landcover data)


Landcover fractions @ 2km distance


Landcover fractions @ 20 km distance


Legend


Distance to open water bodies [km]:

6.4

Distance to urban areas [km]:

3.64


Radius: 1 km

Number of landcover classes:

3

Dominant landcover type:

130: grassland

Fraction of dominant landcover type [%]:

85.0


Radius: 2 km

Number of landcover classes:

3

Dominant landcover type:

130: grassland

Fraction of dominant landcover type [%]:

92.0


Radius: 5 km

Number of landcover classes:

5

Dominant landcover type:

130: grassland

Fraction of dominant landcover type [%]:

84.0


Radius: 10 km

Number of landcover classes:

7

Dominant landcover type:

130: grassland

Fraction of dominant landcover type [%]:

75.0


Radius: 20 km

Number of landcover classes:

6

Dominant landcover type:

130: grassland

Fraction of dominant landcover type [%]:

58.0


Disturbances


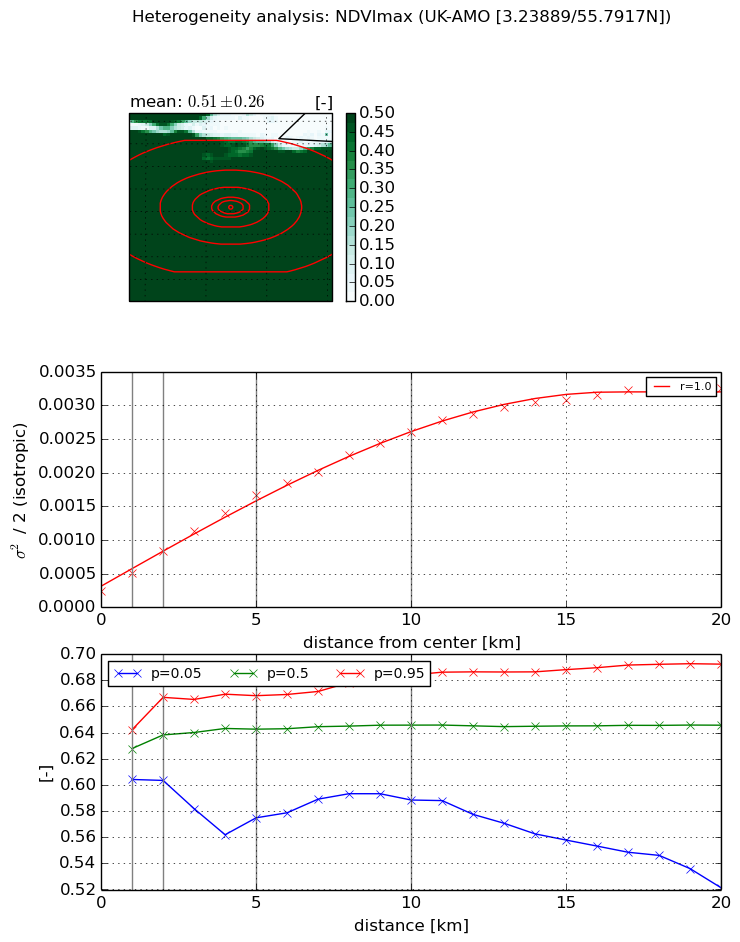
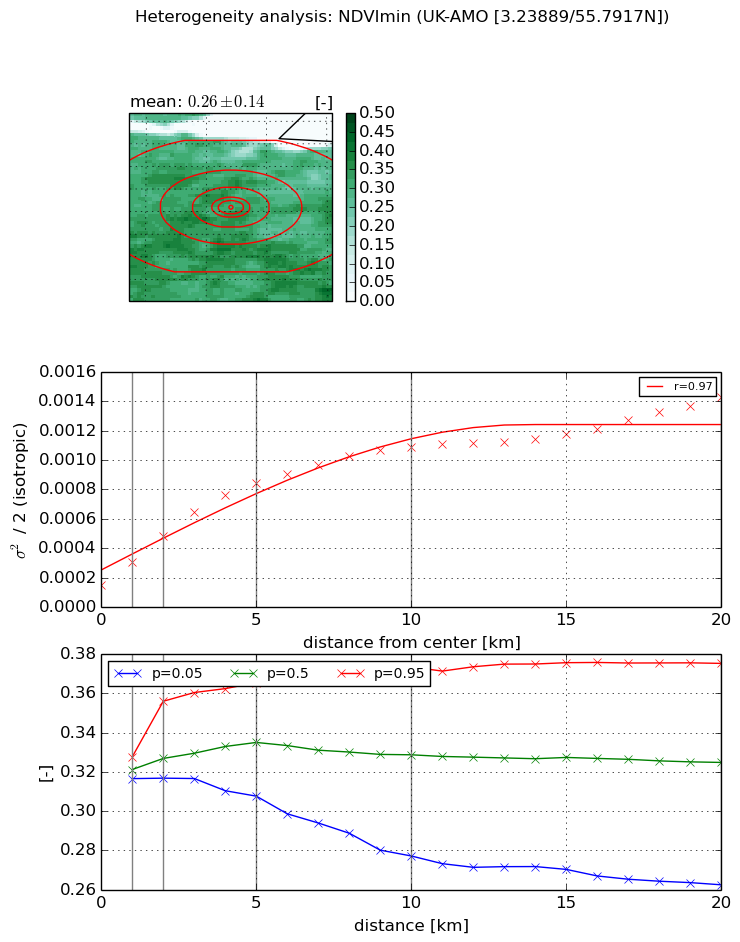
Heterogeneity analysis

The heterogeneity analysis provides information about the spatial and temporal heterogeneity of the site.

Topography


Roman et al. (2009) index


St

0.000336852430122

Rcv

0.286428038295

Rse

0.0

Rst

-0.0474185271113

Rsv

8905.64316809


Height range @ 1km [m]

23

Height range @ 2km [m]

51

Height range @ 5km [m]

90

Height range @ 10km [m]

-999

Height range @ 20km [m]

-999


Variance slope @ 1 km

475

Variance slope @ 2 km

435

Variance slope @ 5 km

275

Variance slope @ 10 km

-999

Variance slope @ 20 km

-999


NDVI (max. NDVI composite)


Roman et al. (2009) index


St

nan

Rcv

nan

Rse

nan

Rst

nan

Rsv

nan


NDVI range @ 1km [-]

0.04

NDVI range @ 2km [-]

0.06

NDVI range @ 5km [-]

0.09

NDVI range @ 10km [-]

0.1

NDVI range @ 20km [-]

0.17


Variance slope @ 1 km

0.000263080526814

Variance slope @ 2 km

0.000292585380595

Variance slope @ 5 km

0.000288032393834

Variance slope @ 10 km

0.000236574327663

Variance slope @ 20 km

0.000149962021465


NDVI (min. NDVI composite)I


Roman et al. (2009) index


St

2.01656121489

Rcv

0.302002502285

Rse

0.0

Rst

-0.185680609635

Rsv

-0.999997984913


NDVI range @ 1km [-]

0.01

NDVI range @ 2km [-]

0.04

NDVI range @ 5km [-]

0.06

NDVI range @ 10km [-]

0.1

NDVI range @ 20km [-]

0.11


NDVI slope @ 1 km

0.000157803352373

NDVI slope @ 2 km

0.000166582698011

NDVI slope @ 5 km

0.000141892101905

NDVI slope @ 10 km

9.20496573648e-05

NDVI slope @ 20 km

5.11569068178e-05


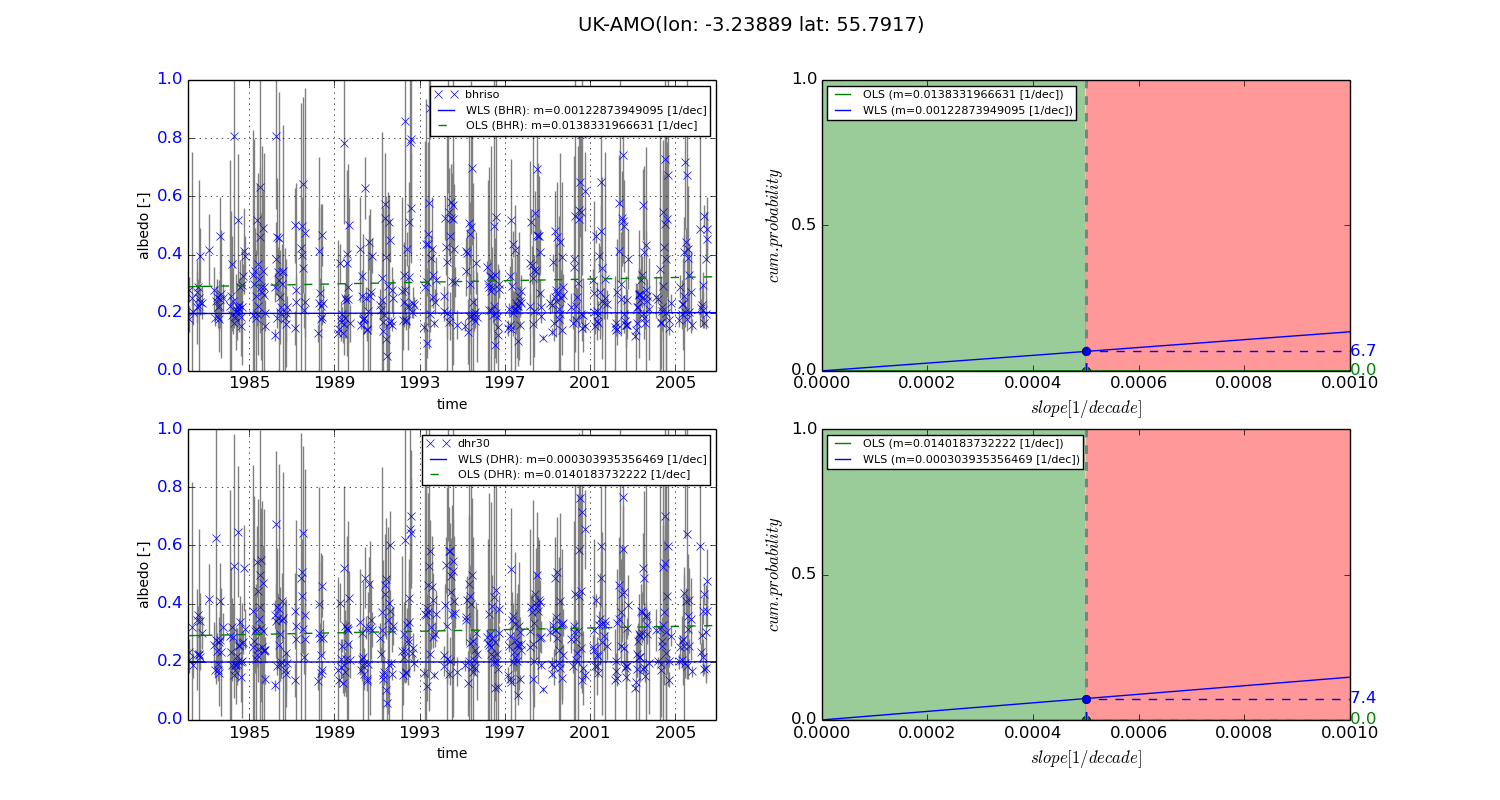
Temporal stability analysis

+000 deg (BHR)


BHR statistics

Temporal stability [1/decade]:


abs

rel


Weighted least square:

0.00122873949095


Ordinary least square:

0.0138331966631


Probabilities that GCOS criteria is met:

Weighted least square:

6.7 %

Ordinary least square:

0.0 %


DHR statistics

Temporal stability [1/decade]:


abs

rel


Weighted least square:

0.000303935356469


Ordinary least square:

0.0140183732222


Probabilities that GCOS criteria is met:

Weighted least square:

7.4 %

Ordinary least square:

0.0 %


+057/+063 deg (BHR)


BHR statistics

Temporal stability [1/decade]:


abs

rel


Weighted least square:

-99999.0


Ordinary least square:

-99999.0


Probabilities that GCOS criteria is met:

Weighted least square:

-99999.0 %

Ordinary least square:

-99999.0 %


DHR statistics

Temporal stability [1/decade]:


abs

rel


Weighted least square:

-99999.0


Ordinary least square:

-99999.0


Probabilities that GCOS criteria is met:

Weighted least square:

-99999.0 %

Ordinary least square:

-99999.0 %


Temporal anomaly analyis

The variance of the temporal anomalies provides an additional measure about the stability of the signal AFTER removal of the mean seasonal cylce.
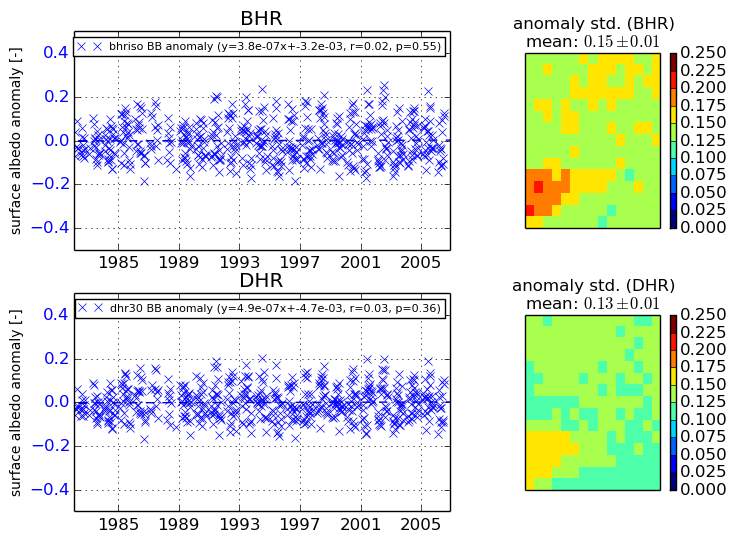
+000 deg


+057/+063 deg