ULAANGOM


Location

lon / lat [deg]: 92.0782 / 49.973

Source network: AERONET


Geostationary surface albedo (GSA) data


“+000”


“+057/+063”


Landcover information (based on ESA CCI landcover data)


Landcover fractions @ 2km distance


Landcover fractions @ 20 km distance


Legend


Distance to open water bodies [km]:

24.39

Distance to urban areas [km]:

0.1


Radius: 1 km

Number of landcover classes:

5

Dominant landcover type:

190: urban areas

Fraction of dominant landcover type [%]:

58.0


Radius: 2 km

Number of landcover classes:

5

Dominant landcover type:

190: urban areas

Fraction of dominant landcover type [%]:

45.0


Radius: 5 km

Number of landcover classes:

5

Dominant landcover type:

20: cropland, irrigated or post-flooded

Fraction of dominant landcover type [%]:

46.0


Radius: 10 km

Number of landcover classes:

5

Dominant landcover type:

200: bare areas

Fraction of dominant landcover type [%]:

54.0


Radius: 20 km

Number of landcover classes:

4

Dominant landcover type:

200: bare areas

Fraction of dominant landcover type [%]:

59.0


Disturbances


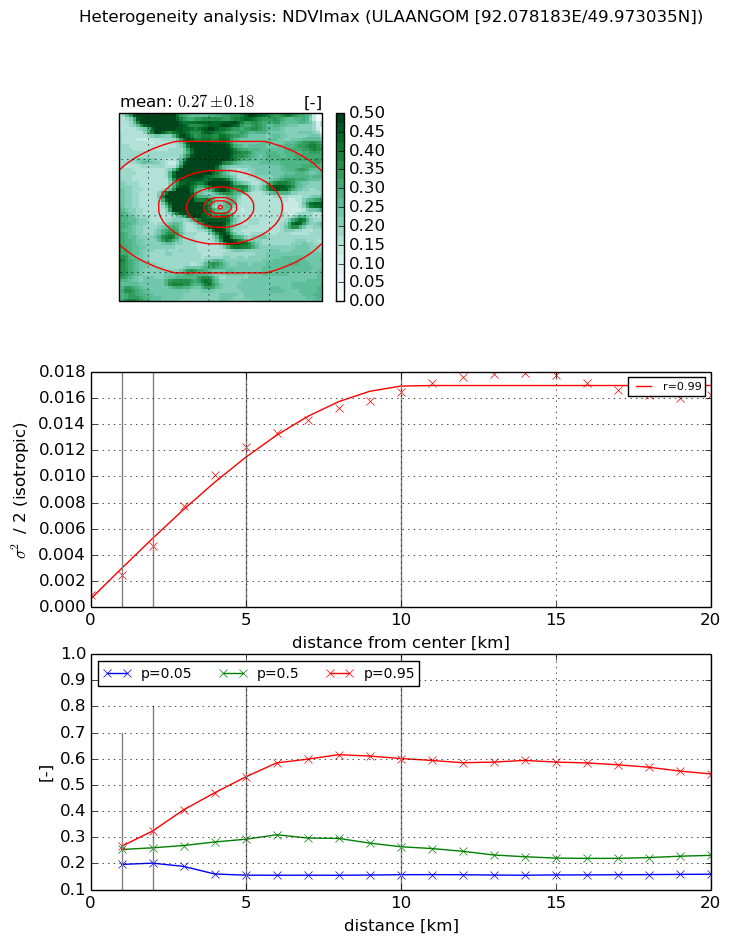
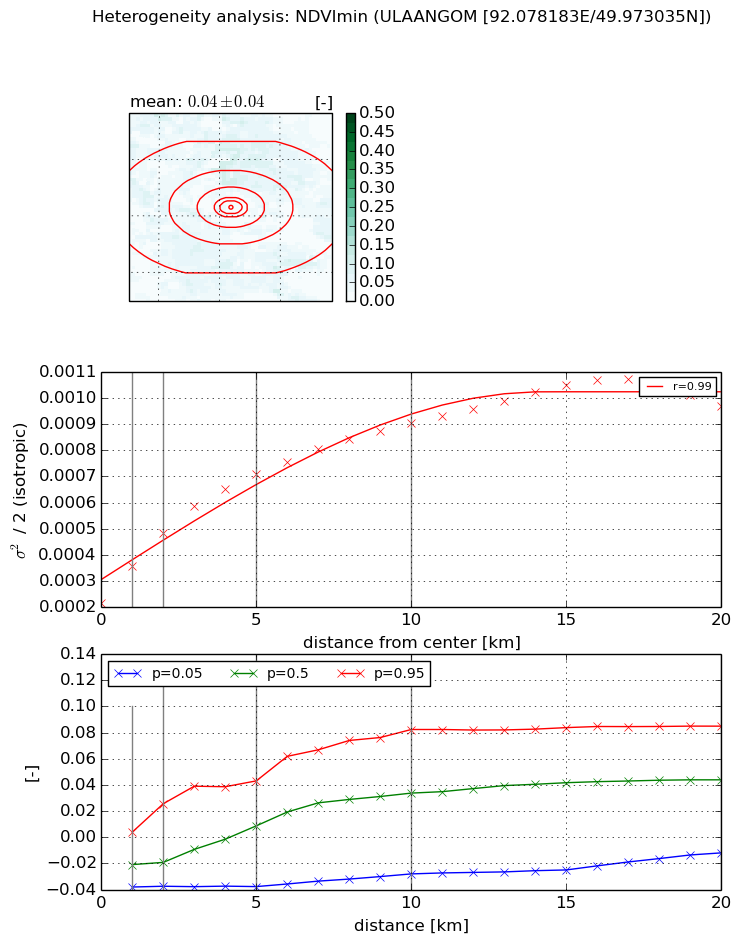
Heterogeneity analysis

The heterogeneity analysis provides information about the spatial and temporal heterogeneity of the site.

Topography


Roman et al. (2009) index


St

3.59031318566

Rcv

0.414805076157

Rse

0.0

Rst

-2.35326660951e-06

Rsv

-0.420774271911


Height range @ 1km [m]

16

Height range @ 2km [m]

37

Height range @ 5km [m]

96

Height range @ 10km [m]

-999

Height range @ 20km [m]

-999


Variance slope @ 1 km

159

Variance slope @ 2 km

175

Variance slope @ 5 km

200

Variance slope @ 10 km

-999

Variance slope @ 20 km

-999


NDVI (max. NDVI composite)


Roman et al. (2009) index


St

0.0262148592069

Rcv

0.572299067602

Rse

0.0

Rst

1.21333243041e-06

Rsv

113.866613021


NDVI range @ 1km [-]

0.07

NDVI range @ 2km [-]

0.12

NDVI range @ 5km [-]

0.38

NDVI range @ 10km [-]

0.44

NDVI range @ 20km [-]

0.38


Variance slope @ 1 km

0.0015369741693

Variance slope @ 2 km

0.00190385359626

Variance slope @ 5 km

0.00236662362515

Variance slope @ 10 km

0.00163090875771

Variance slope @ 20 km

0.000694976904277


NDVI (min. NDVI composite)I


Roman et al. (2009) index


St

1.35244541513

Rcv

-1.748695625

Rse

0.0

Rst

0.111839799076

Rsv

-0.357668701902


NDVI range @ 1km [-]

0.04

NDVI range @ 2km [-]

0.06

NDVI range @ 5km [-]

0.08

NDVI range @ 10km [-]

0.11

NDVI range @ 20km [-]

0.1


NDVI slope @ 1 km

0.000141731145533

NDVI slope @ 2 km

0.000133032668276

NDVI slope @ 5 km

9.80725249601e-05

NDVI slope @ 10 km

6.45826757163e-05

NDVI slope @ 20 km

3.5639100723e-05


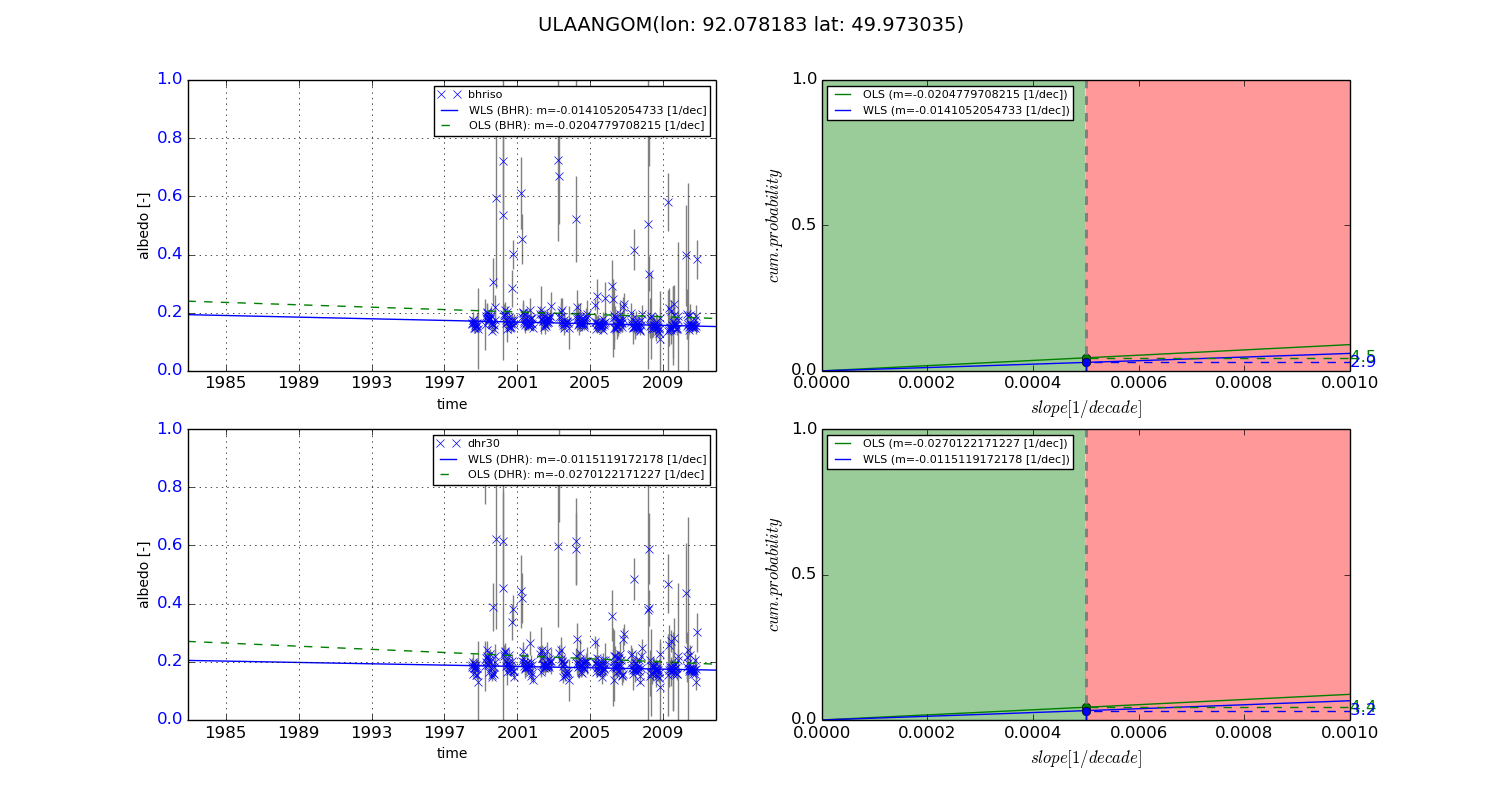
Temporal stability analysis

+000 deg (BHR)


BHR statistics

Temporal stability [1/decade]:


abs

rel


Weighted least square:

None


Ordinary least square:

None


Probabilities that GCOS criteria is met:

Weighted least square:

None %

Ordinary least square:

None %


DHR statistics

Temporal stability [1/decade]:


abs

rel


Weighted least square:

None


Ordinary least square:

None


Probabilities that GCOS criteria is met:

Weighted least square:

None %

Ordinary least square:

None %


+057/+063 deg (BHR)


BHR statistics

Temporal stability [1/decade]:


abs

rel


Weighted least square:

-0.0141052054733


Ordinary least square:

-0.0204779708215


Probabilities that GCOS criteria is met:

Weighted least square:

2.9 %

Ordinary least square:

4.5 %


DHR statistics

Temporal stability [1/decade]:


abs

rel


Weighted least square:

-0.0115119172178


Ordinary least square:

-0.0270122171227


Probabilities that GCOS criteria is met:

Weighted least square:

3.2 %

Ordinary least square:

4.4 %


Temporal anomaly analyis

The variance of the temporal anomalies provides an additional measure about the stability of the signal AFTER removal of the mean seasonal cylce.

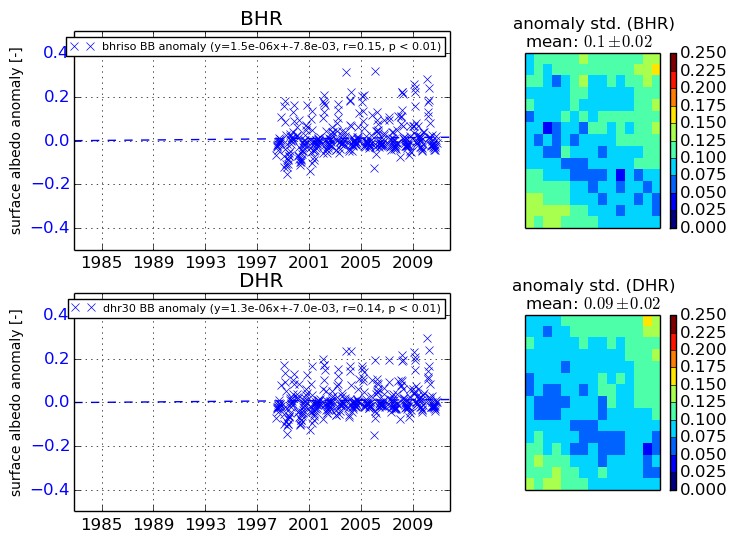
+000 deg


+057/+063 deg