US-ARC


Location

lon / lat [deg]: -98.04 / 35.5465

Source network: FLUXNET


Geostationary surface albedo (GSA) data


“+000”


“+057/+063”


Landcover information (based on ESA CCI landcover data)


Landcover fractions @ 2km distance


Landcover fractions @ 20 km distance


Legend


Distance to open water bodies [km]:

2.29

Distance to urban areas [km]:

5.43


Radius: 1 km

Number of landcover classes:

3

Dominant landcover type:

130: grassland

Fraction of dominant landcover type [%]:

58.0


Radius: 2 km

Number of landcover classes:

3

Dominant landcover type:

130: grassland

Fraction of dominant landcover type [%]:

72.0


Radius: 5 km

Number of landcover classes:

3

Dominant landcover type:

130: grassland

Fraction of dominant landcover type [%]:

71.0


Radius: 10 km

Number of landcover classes:

4

Dominant landcover type:

130: grassland

Fraction of dominant landcover type [%]:

68.0


Radius: 20 km

Number of landcover classes:

4

Dominant landcover type:

130: grassland

Fraction of dominant landcover type [%]:

71.0


Disturbances


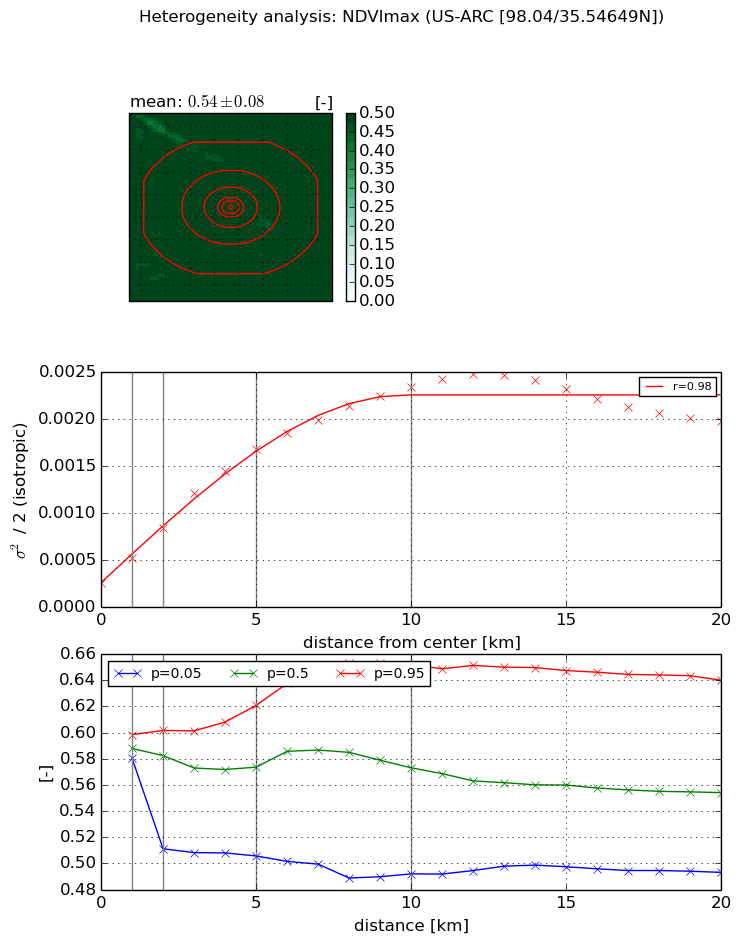
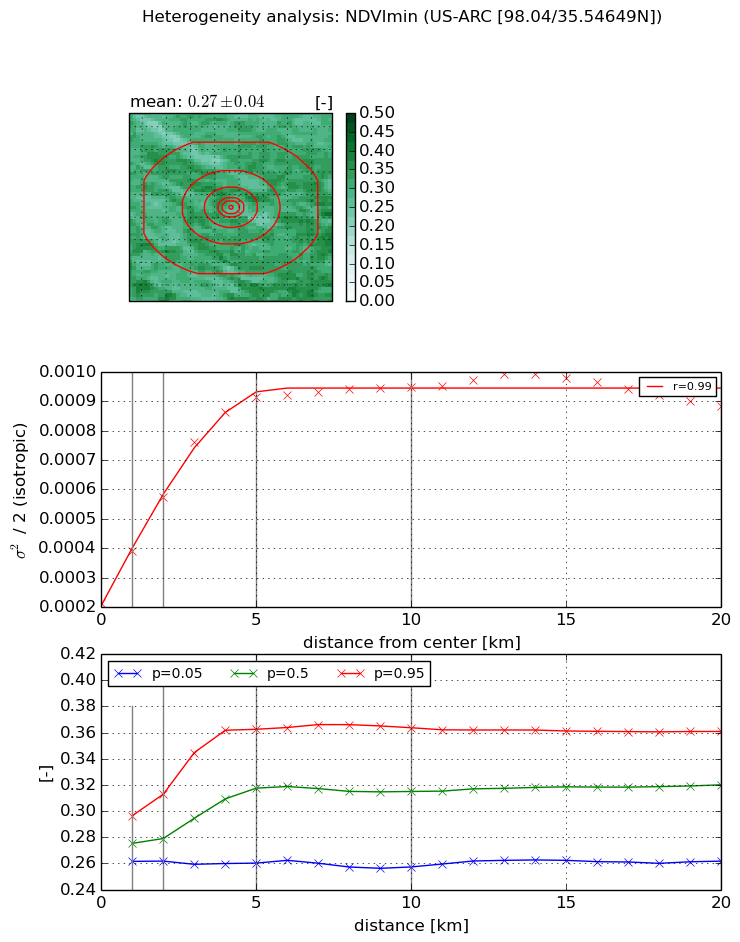
Heterogeneity analysis

The heterogeneity analysis provides information about the spatial and temporal heterogeneity of the site.

Topography


Roman et al. (2009) index


St

1.97304951067

Rcv

0.540030446051

Rse

0.0

Rst

-4.50510116019e-09

Rsv

-0.980458510199


Height range @ 1km [m]

15

Height range @ 2km [m]

18

Height range @ 5km [m]

32

Height range @ 10km [m]

-999

Height range @ 20km [m]

-999


Variance slope @ 1 km

15

Variance slope @ 2 km

15

Variance slope @ 5 km

18

Variance slope @ 10 km

-999

Variance slope @ 20 km

-999


NDVI (max. NDVI composite)


Roman et al. (2009) index


St

2.243391577

Rcv

0.176534972594

Rse

0.0

Rst

-0.160726163545

Rsv

-0.999999835488


NDVI range @ 1km [-]

0.02

NDVI range @ 2km [-]

0.09

NDVI range @ 5km [-]

0.12

NDVI range @ 10km [-]

0.16

NDVI range @ 20km [-]

0.15


Variance slope @ 1 km

0.000265999462099

Variance slope @ 2 km

0.000291853853895

Variance slope @ 5 km

0.000292446246375

Variance slope @ 10 km

0.000209800447463

Variance slope @ 20 km

7.66479967706e-05


NDVI (min. NDVI composite)I


Roman et al. (2009) index


St

8.28220185352e-07

Rcv

0.0435167759796

Rse

0.0

Rst

0.315245287654

Rsv

3622224.80921


NDVI range @ 1km [-]

0.03

NDVI range @ 2km [-]

0.05

NDVI range @ 5km [-]

0.1

NDVI range @ 10km [-]

0.11

NDVI range @ 20km [-]

0.1


NDVI slope @ 1 km

0.000175935956989

NDVI slope @ 2 km

0.000181032006472

NDVI slope @ 5 km

0.000146113792666

NDVI slope @ 10 km

6.71973203829e-05

NDVI slope @ 20 km

2.17950652673e-05


Temporal stability analysis

+000 deg (BHR)


BHR statistics

Temporal stability [1/decade]:


abs

rel


Weighted least square:

None


Ordinary least square:

None


Probabilities that GCOS criteria is met:

Weighted least square:

None %

Ordinary least square:

None %


DHR statistics

Temporal stability [1/decade]:


abs

rel


Weighted least square:

None


Ordinary least square:

None


Probabilities that GCOS criteria is met:

Weighted least square:

None %

Ordinary least square:

None %


+057/+063 deg (BHR)


BHR statistics

Temporal stability [1/decade]:


abs

rel


Weighted least square:

None


Ordinary least square:

None


Probabilities that GCOS criteria is met:

Weighted least square:

None %

Ordinary least square:

None %


DHR statistics

Temporal stability [1/decade]:


abs

rel


Weighted least square:

None


Ordinary least square:

None


Probabilities that GCOS criteria is met:

Weighted least square:

None %

Ordinary least square:

None %


Temporal anomaly analyis

The variance of the temporal anomalies provides an additional measure about the stability of the signal AFTER removal of the mean seasonal cylce.

+000 deg


+057/+063 deg