US-OHO


Location

lon / lat [deg]: -83.8438 / 41.5545

Source network: FLUXNET


Geostationary surface albedo (GSA) data


“+000”


“+057/+063”


Landcover information (based on ESA CCI landcover data)


Landcover fractions @ 2km distance


Landcover fractions @ 20 km distance


Legend


Distance to open water bodies [km]:

0.97

Distance to urban areas [km]:

1.64


Radius: 1 km

Number of landcover classes:

6

Dominant landcover type:

60: Tree cover, broadleaved, decidous

Fraction of dominant landcover type [%]:

59.0


Radius: 2 km

Number of landcover classes:

10

Dominant landcover type:

60: Tree cover, broadleaved, decidous

Fraction of dominant landcover type [%]:

38.0


Radius: 5 km

Number of landcover classes:

8

Dominant landcover type:

10: cropland, rainfed

Fraction of dominant landcover type [%]:

32.0


Radius: 10 km

Number of landcover classes:

7

Dominant landcover type:

10: cropland, rainfed

Fraction of dominant landcover type [%]:

64.0


Radius: 20 km

Number of landcover classes:

7

Dominant landcover type:

10: cropland, rainfed

Fraction of dominant landcover type [%]:

72.0


Disturbances


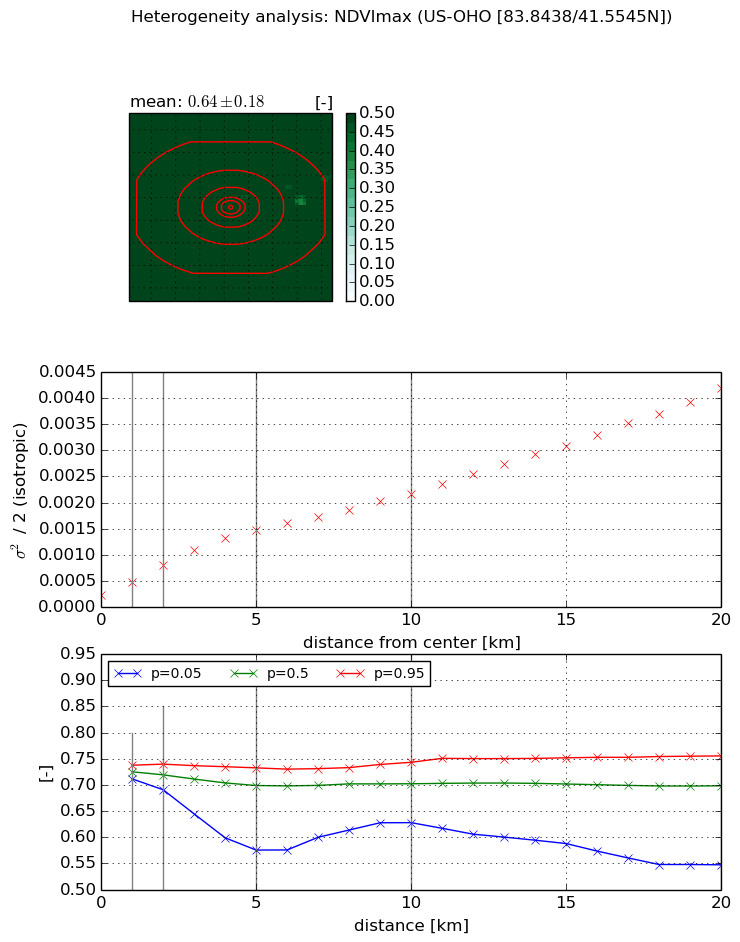
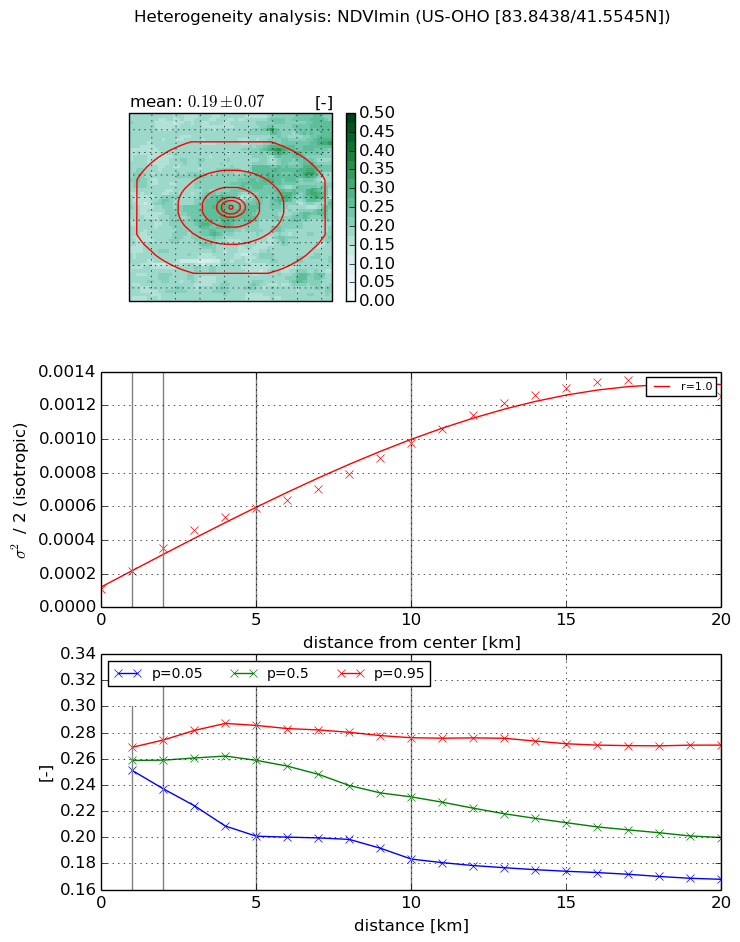
Heterogeneity analysis

The heterogeneity analysis provides information about the spatial and temporal heterogeneity of the site.

Topography


Roman et al. (2009) index


St

5.59527633915

Rcv

0.121762551126

Rse

0.0

Rst

0.201033435032

Rsv

0.213370561866


Height range @ 1km [m]

11

Height range @ 2km [m]

13

Height range @ 5km [m]

18

Height range @ 10km [m]

-999

Height range @ 20km [m]

-999


Variance slope @ 1 km

14

Variance slope @ 2 km

7

Variance slope @ 5 km

4

Variance slope @ 10 km

-999

Variance slope @ 20 km

-999


NDVI (max. NDVI composite)


Roman et al. (2009) index


St

2.80687893455

Rcv

0.517014292478

Rse

0.0

Rst

-1.88051386279e-08

Rsv

0.551788465736


NDVI range @ 1km [-]

0.03

NDVI range @ 2km [-]

0.05

NDVI range @ 5km [-]

0.16

NDVI range @ 10km [-]

0.12

NDVI range @ 20km [-]

0.21


Variance slope @ 1 km

0.000243353656

Variance slope @ 2 km

0.000290254225245

Variance slope @ 5 km

0.000258223019345

Variance slope @ 10 km

0.000187343957523

Variance slope @ 20 km

0.000182657807336


NDVI (min. NDVI composite)I


Roman et al. (2009) index


St

1.39496780305e-06

Rcv

0.270701601599

Rse

0.0

Rst

0.00310718464743

Rsv

2150586.99669


NDVI range @ 1km [-]

0.02

NDVI range @ 2km [-]

0.04

NDVI range @ 5km [-]

0.08

NDVI range @ 10km [-]

0.09

NDVI range @ 20km [-]

0.1


NDVI slope @ 1 km

0.000107911280488

NDVI slope @ 2 km

0.000122728970459

NDVI slope @ 5 km

9.90876834042e-05

NDVI slope @ 10 km

8.12605276325e-05

NDVI slope @ 20 km

6.29029454932e-05


Temporal stability analysis

+000 deg (BHR)


BHR statistics

Temporal stability [1/decade]:


abs

rel


Weighted least square:

None


Ordinary least square:

None


Probabilities that GCOS criteria is met:

Weighted least square:

None %

Ordinary least square:

None %


DHR statistics

Temporal stability [1/decade]:


abs

rel


Weighted least square:

None


Ordinary least square:

None


Probabilities that GCOS criteria is met:

Weighted least square:

None %

Ordinary least square:

None %


+057/+063 deg (BHR)


BHR statistics

Temporal stability [1/decade]:


abs

rel


Weighted least square:

None


Ordinary least square:

None


Probabilities that GCOS criteria is met:

Weighted least square:

None %

Ordinary least square:

None %


DHR statistics

Temporal stability [1/decade]:


abs

rel


Weighted least square:

None


Ordinary least square:

None


Probabilities that GCOS criteria is met:

Weighted least square:

None %

Ordinary least square:

None %


Temporal anomaly analyis

The variance of the temporal anomalies provides an additional measure about the stability of the signal AFTER removal of the mean seasonal cylce.

+000 deg


+057/+063 deg