US-WBW


Location

lon / lat [deg]: -84.2874 / 35.9588

Source network: FLUXNET


Geostationary surface albedo (GSA) data


“+000”


“+057/+063”


Landcover information (based on ESA CCI landcover data)


Landcover fractions @ 2km distance


Landcover fractions @ 20 km distance


Legend


Distance to open water bodies [km]:

1.71

Distance to urban areas [km]:

1.03


Radius: 1 km

Number of landcover classes:

2

Dominant landcover type:

61: Tree cover, broadleaved, decidous (closed > 40%)

Fraction of dominant landcover type [%]:

56.0


Radius: 2 km

Number of landcover classes:

5

Dominant landcover type:

130: grassland

Fraction of dominant landcover type [%]:

53.0


Radius: 5 km

Number of landcover classes:

6

Dominant landcover type:

130: grassland

Fraction of dominant landcover type [%]:

34.0


Radius: 10 km

Number of landcover classes:

7

Dominant landcover type:

130: grassland

Fraction of dominant landcover type [%]:

49.0


Radius: 20 km

Number of landcover classes:

6

Dominant landcover type:

130: grassland

Fraction of dominant landcover type [%]:

60.0


Disturbances


Heterogeneity analysis

The heterogeneity analysis provides information about the spatial and temporal heterogeneity of the site.

Topography


Roman et al. (2009) index


St

17.6378327013

Rcv

0.066374816475

Rse

0.0

Rst

-0.0534666140929

Rsv

0.0502474942336


Height range @ 1km [m]

66

Height range @ 2km [m]

90

Height range @ 5km [m]

97

Height range @ 10km [m]

-999

Height range @ 20km [m]

-999


Variance slope @ 1 km

704

Variance slope @ 2 km

339

Variance slope @ 5 km

149

Variance slope @ 10 km

-999

Variance slope @ 20 km

-999


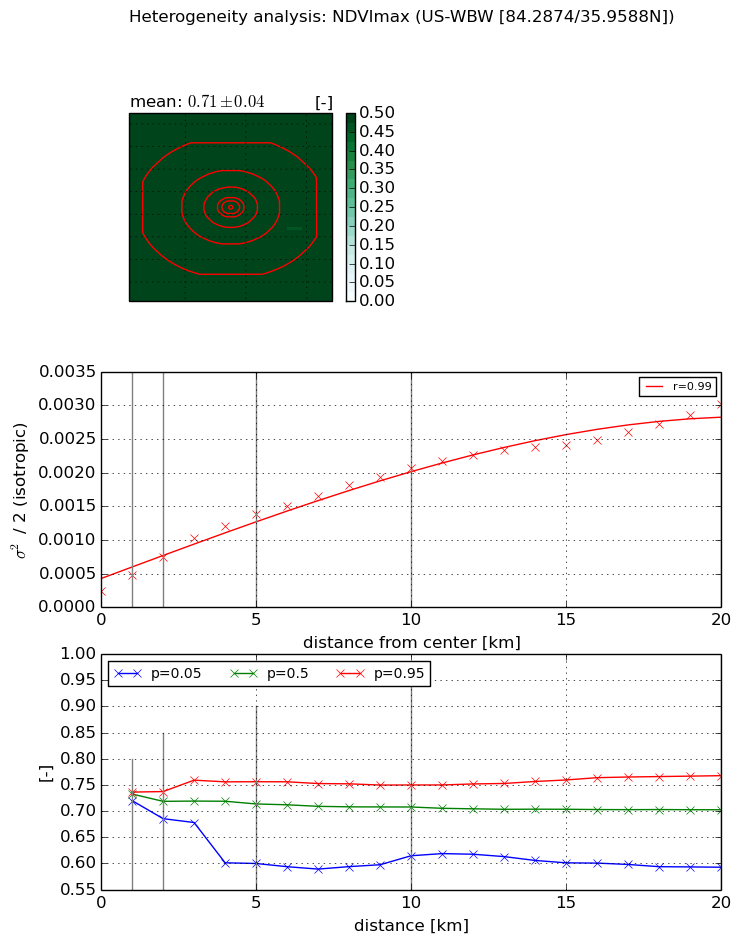
NDVI (max. NDVI composite)


Roman et al. (2009) index


St

6.04734862175e-07

Rcv

0.469052944309

Rse

0.0

Rst

0.00197118913656

Rsv

4960851.28012


NDVI range @ 1km [-]

0.02

NDVI range @ 2km [-]

0.05

NDVI range @ 5km [-]

0.16

NDVI range @ 10km [-]

0.14

NDVI range @ 20km [-]

0.18


Variance slope @ 1 km

0.000234891527825

Variance slope @ 2 km

0.000250391499417

Variance slope @ 5 km

0.00023463155784

Variance slope @ 10 km

0.000180102659187

Variance slope @ 20 km

0.000124439655944


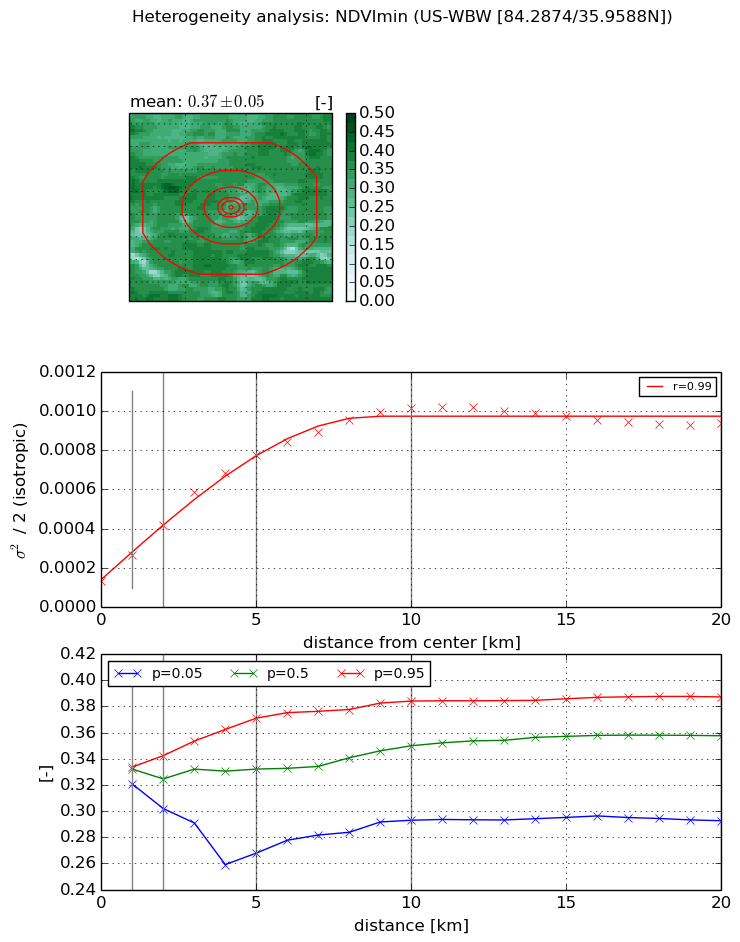
NDVI (min. NDVI composite)I


Roman et al. (2009) index


St

4.58686002939e-08

Rcv

0.302591157519

Rse

0.0

Rst

-0.0501145506233

Rsv

65404219.1085


NDVI range @ 1km [-]

0.01

NDVI range @ 2km [-]

0.04

NDVI range @ 5km [-]

0.1

NDVI range @ 10km [-]

0.09

NDVI range @ 20km [-]

0.09


NDVI slope @ 1 km

0.000135631938385

NDVI slope @ 2 km

0.000144199209707

NDVI slope @ 5 km

0.000132718102327

NDVI slope @ 10 km

8.81430098981e-05

NDVI slope @ 20 km

3.15920118285e-05


Temporal stability analysis

+000 deg (BHR)


BHR statistics

Temporal stability [1/decade]:


abs

rel


Weighted least square:

None


Ordinary least square:

None


Probabilities that GCOS criteria is met:

Weighted least square:

None %

Ordinary least square:

None %


DHR statistics

Temporal stability [1/decade]:


abs

rel


Weighted least square:

None


Ordinary least square:

None


Probabilities that GCOS criteria is met:

Weighted least square:

None %

Ordinary least square:

None %


+057/+063 deg (BHR)


BHR statistics

Temporal stability [1/decade]:


abs

rel


Weighted least square:

None


Ordinary least square:

None


Probabilities that GCOS criteria is met:

Weighted least square:

None %

Ordinary least square:

None %


DHR statistics

Temporal stability [1/decade]:


abs

rel


Weighted least square:

None


Ordinary least square:

None


Probabilities that GCOS criteria is met:

Weighted least square:

None %

Ordinary least square:

None %


Temporal anomaly analyis

The variance of the temporal anomalies provides an additional measure about the stability of the signal AFTER removal of the mean seasonal cylce.

+000 deg


+057/+063 deg