US-WI7


Location

lon / lat [deg]: -91.0693 / 46.6491

Source network: FLUXNET


Geostationary surface albedo (GSA) data


“+000”


“+057/+063”


Landcover information (based on ESA CCI landcover data)


Landcover fractions @ 2km distance


Landcover fractions @ 20 km distance


Legend


Distance to open water bodies [km]:

1.34

Distance to urban areas [km]:

4.24


Radius: 1 km

Number of landcover classes:

5

Dominant landcover type:

130: grassland

Fraction of dominant landcover type [%]:

62.0


Radius: 2 km

Number of landcover classes:

6

Dominant landcover type:

60: Tree cover, broadleaved, decidous

Fraction of dominant landcover type [%]:

37.0


Radius: 5 km

Number of landcover classes:

6

Dominant landcover type:

60: Tree cover, broadleaved, decidous

Fraction of dominant landcover type [%]:

46.0


Radius: 10 km

Number of landcover classes:

7

Dominant landcover type:

60: Tree cover, broadleaved, decidous

Fraction of dominant landcover type [%]:

36.0


Radius: 20 km

Number of landcover classes:

8

Dominant landcover type:

60: Tree cover, broadleaved, decidous

Fraction of dominant landcover type [%]:

33.0


Disturbances


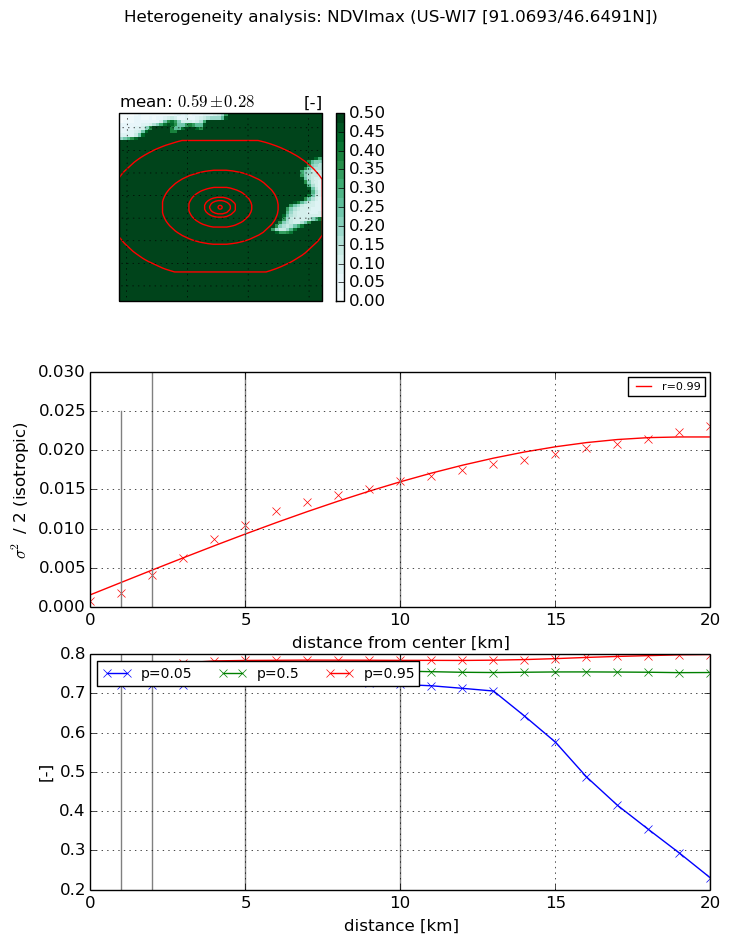
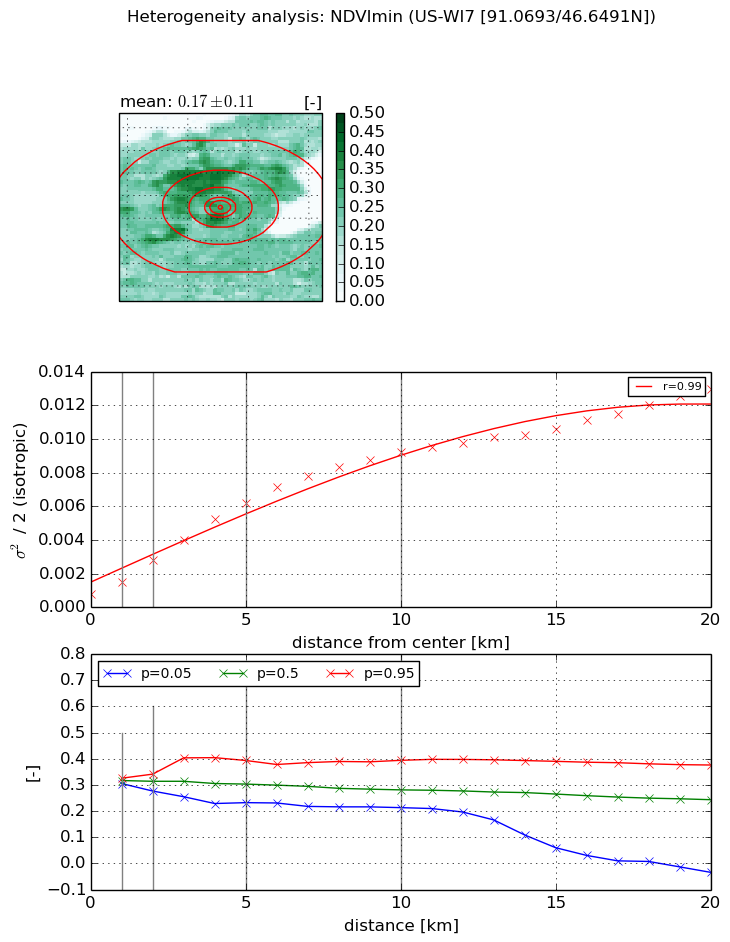
Heterogeneity analysis

The heterogeneity analysis provides information about the spatial and temporal heterogeneity of the site.

Topography


Roman et al. (2009) index


St

2.97045663766

Rcv

0.254071190448

Rse

0.0

Rst

-1.85782785353e-06

Rsv

-0.755872682614


Height range @ 1km [m]

23

Height range @ 2km [m]

38

Height range @ 5km [m]

97

Height range @ 10km [m]

-999

Height range @ 20km [m]

-999


Variance slope @ 1 km

161

Variance slope @ 2 km

164

Variance slope @ 5 km

158

Variance slope @ 10 km

-999

Variance slope @ 20 km

-999


NDVI (max. NDVI composite)


Roman et al. (2009) index


St

2.85385936527

Rcv

-0.0657285757965

Rse

0.0

Rst

-0.232617830987

Rsv

0.752861664821


NDVI range @ 1km [-]

0.03

NDVI range @ 2km [-]

0.04

NDVI range @ 5km [-]

0.05

NDVI range @ 10km [-]

0.06

NDVI range @ 20km [-]

0.57


Variance slope @ 1 km

0.00109119288354

Variance slope @ 2 km

0.00167544449628

Variance slope @ 5 km

0.00204631608626

Variance slope @ 10 km

0.00161867113543

Variance slope @ 20 km

0.00105463291318


NDVI (min. NDVI composite)I


Roman et al. (2009) index


St

9.72837015069e-08

Rcv

0.0986863923206

Rse

0.0

Rst

0.537817191699

Rsv

30837641.7797


NDVI range @ 1km [-]

0.02

NDVI range @ 2km [-]

0.06

NDVI range @ 5km [-]

0.16

NDVI range @ 10km [-]

0.18

NDVI range @ 20km [-]

0.41


NDVI slope @ 1 km

0.000718050056183

NDVI slope @ 2 km

0.00100377800922

NDVI slope @ 5 km

0.00112971286688

NDVI slope @ 10 km

0.00088446353295

NDVI slope @ 20 km

0.00055550915481


Temporal stability analysis

+000 deg (BHR)


BHR statistics

Temporal stability [1/decade]:


abs

rel


Weighted least square:

None


Ordinary least square:

None


Probabilities that GCOS criteria is met:

Weighted least square:

None %

Ordinary least square:

None %


DHR statistics

Temporal stability [1/decade]:


abs

rel


Weighted least square:

None


Ordinary least square:

None


Probabilities that GCOS criteria is met:

Weighted least square:

None %

Ordinary least square:

None %


+057/+063 deg (BHR)


BHR statistics

Temporal stability [1/decade]:


abs

rel


Weighted least square:

None


Ordinary least square:

None


Probabilities that GCOS criteria is met:

Weighted least square:

None %

Ordinary least square:

None %


DHR statistics

Temporal stability [1/decade]:


abs

rel


Weighted least square:

None


Ordinary least square:

None


Probabilities that GCOS criteria is met:

Weighted least square:

None %

Ordinary least square:

None %


Temporal anomaly analyis

The variance of the temporal anomalies provides an additional measure about the stability of the signal AFTER removal of the mean seasonal cylce.

+000 deg


+057/+063 deg