VALLADOLID_SCI


Location

lon / lat [deg]: -4.7148 / 41.6562

Source network: AERONET


Geostationary surface albedo (GSA) data


“+000”


“+057/+063”


Landcover information (based on ESA CCI landcover data)


Landcover fractions @ 2km distance


Landcover fractions @ 20 km distance


Legend


Distance to open water bodies [km]:

9.85

Distance to urban areas [km]:

0.09


Radius: 1 km

Number of landcover classes:

1

Dominant landcover type:

190: urban areas

Fraction of dominant landcover type [%]:

100.0


Radius: 2 km

Number of landcover classes:

2

Dominant landcover type:

190: urban areas

Fraction of dominant landcover type [%]:

97.0


Radius: 5 km

Number of landcover classes:

3

Dominant landcover type:

190: urban areas

Fraction of dominant landcover type [%]:

54.0


Radius: 10 km

Number of landcover classes:

5

Dominant landcover type:

10: cropland, rainfed

Fraction of dominant landcover type [%]:

54.0


Radius: 20 km

Number of landcover classes:

7

Dominant landcover type:

10: cropland, rainfed

Fraction of dominant landcover type [%]:

61.0


Disturbances


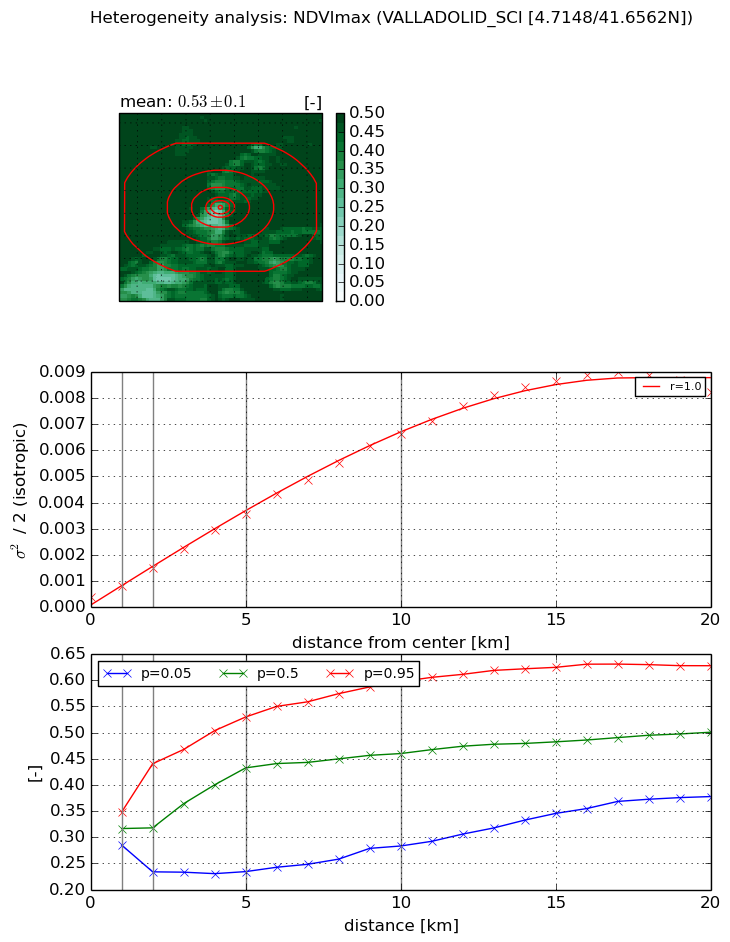
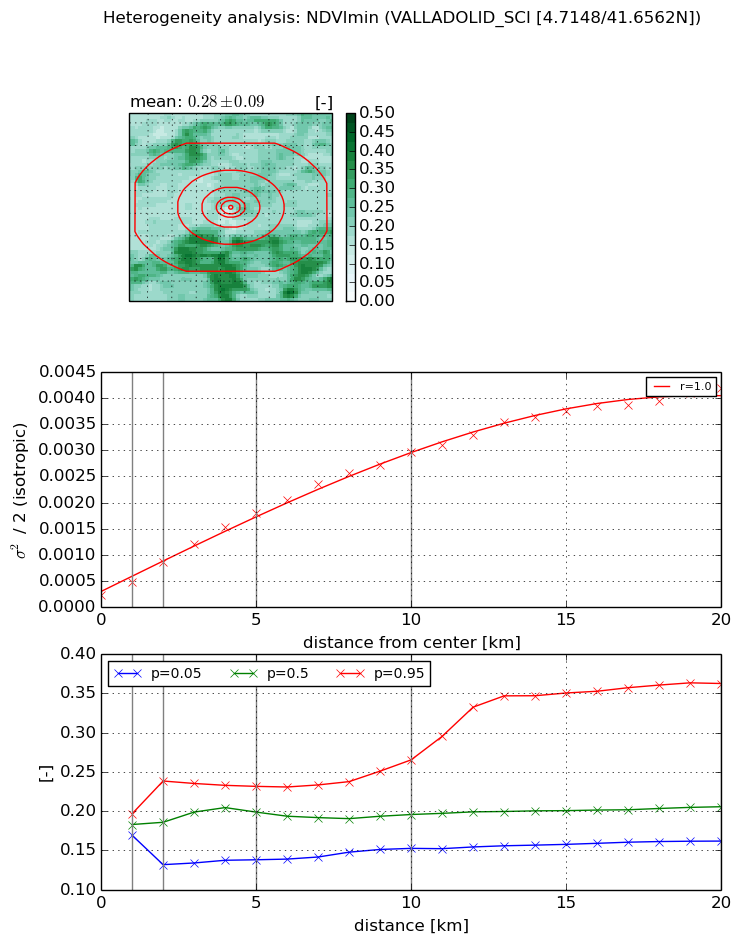
Heterogeneity analysis

The heterogeneity analysis provides information about the spatial and temporal heterogeneity of the site.

Topography


Roman et al. (2009) index


St

2.19170606456

Rcv

0.978371890572

Rse

0.0

Rst

0.0767051609435

Rsv

0.313719635463


Height range @ 1km [m]

10

Height range @ 2km [m]

22

Height range @ 5km [m]

71

Height range @ 10km [m]

-999

Height range @ 20km [m]

-999


Variance slope @ 1 km

282

Variance slope @ 2 km

253

Variance slope @ 5 km

174

Variance slope @ 10 km

-999

Variance slope @ 20 km

-999


NDVI (max. NDVI composite)


Roman et al. (2009) index


St

24.9245847885

Rcv

0.0402516188363

Rse

0.0

Rst

-0.0488387176726

Rsv

-0.0312727518016


NDVI range @ 1km [-]

0.06

NDVI range @ 2km [-]

0.21

NDVI range @ 5km [-]

0.3

NDVI range @ 10km [-]

0.31

NDVI range @ 20km [-]

0.25


Variance slope @ 1 km

0.000447942117774

Variance slope @ 2 km

0.000566545497689

Variance slope @ 5 km

0.000657210702508

Variance slope @ 10 km

0.00064906507785

Variance slope @ 20 km

0.000451994459523


NDVI (min. NDVI composite)I


Roman et al. (2009) index


St

6.85533775227

Rcv

-0.132266666854

Rse

0.0

Rst

-0.0760640432953

Rsv

0.229284489628


NDVI range @ 1km [-]

0.03

NDVI range @ 2km [-]

0.11

NDVI range @ 5km [-]

0.09

NDVI range @ 10km [-]

0.11

NDVI range @ 20km [-]

0.2


NDVI slope @ 1 km

0.000257942004916

NDVI slope @ 2 km

0.00031476109755

NDVI slope @ 5 km

0.000324583058107

NDVI slope @ 10 km

0.000279128821128

NDVI slope @ 20 km

0.000196046811435


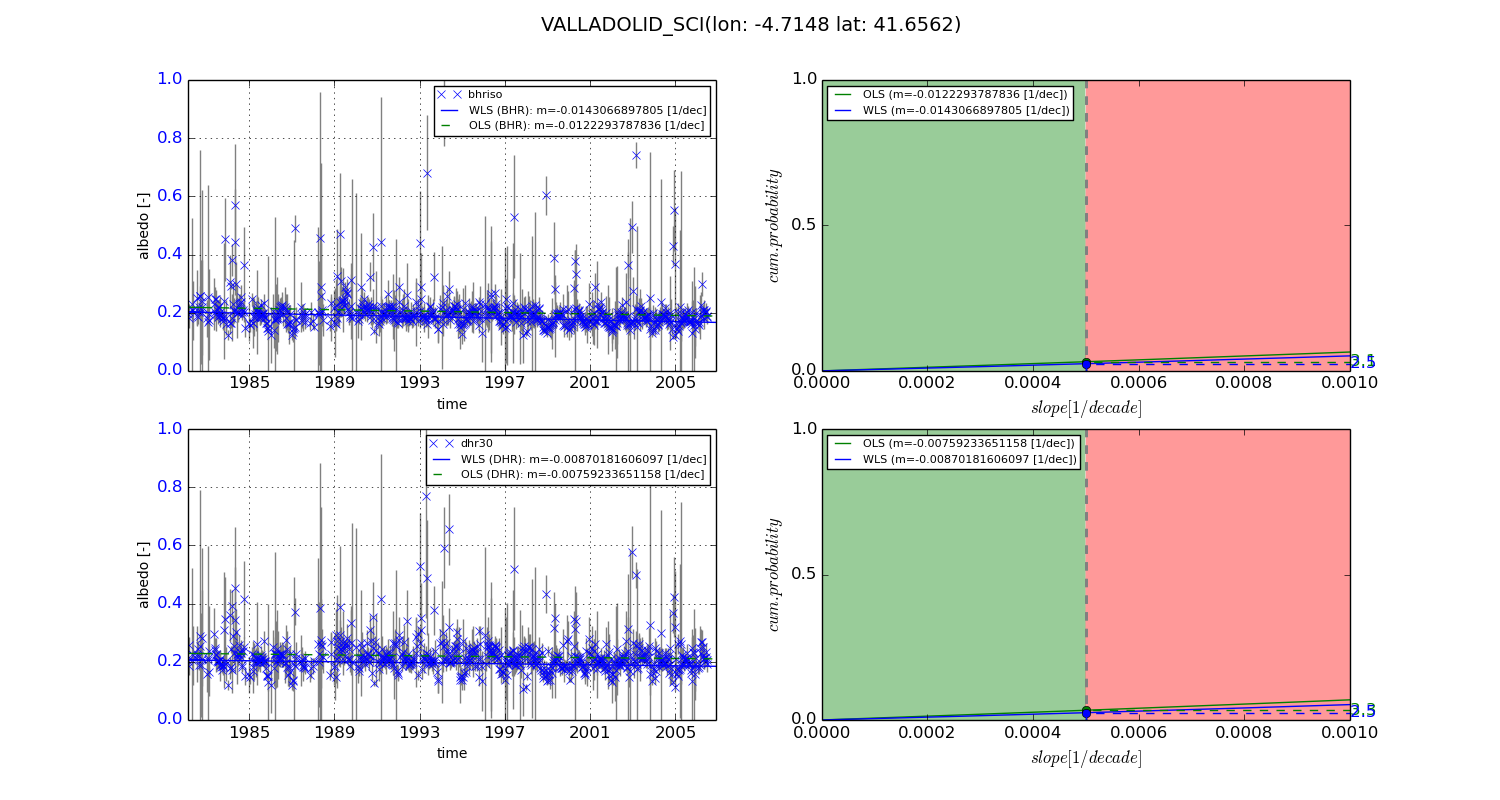
Temporal stability analysis

+000 deg (BHR)


BHR statistics

Temporal stability [1/decade]:


abs

rel


Weighted least square:

-0.0143066897805


Ordinary least square:

-0.0122293787836


Probabilities that GCOS criteria is met:

Weighted least square:

2.5 %

Ordinary least square:

3.1 %


DHR statistics

Temporal stability [1/decade]:


abs

rel


Weighted least square:

-0.00870181606097


Ordinary least square:

-0.00759233651158


Probabilities that GCOS criteria is met:

Weighted least square:

2.5 %

Ordinary least square:

3.3 %


+057/+063 deg (BHR)


BHR statistics

Temporal stability [1/decade]:


abs

rel


Weighted least square:

-99999.0


Ordinary least square:

-99999.0


Probabilities that GCOS criteria is met:

Weighted least square:

-99999.0 %

Ordinary least square:

-99999.0 %


DHR statistics

Temporal stability [1/decade]:


abs

rel


Weighted least square:

-99999.0


Ordinary least square:

-99999.0


Probabilities that GCOS criteria is met:

Weighted least square:

-99999.0 %

Ordinary least square:

-99999.0 %


Temporal anomaly analyis

The variance of the temporal anomalies provides an additional measure about the stability of the signal AFTER removal of the mean seasonal cylce.
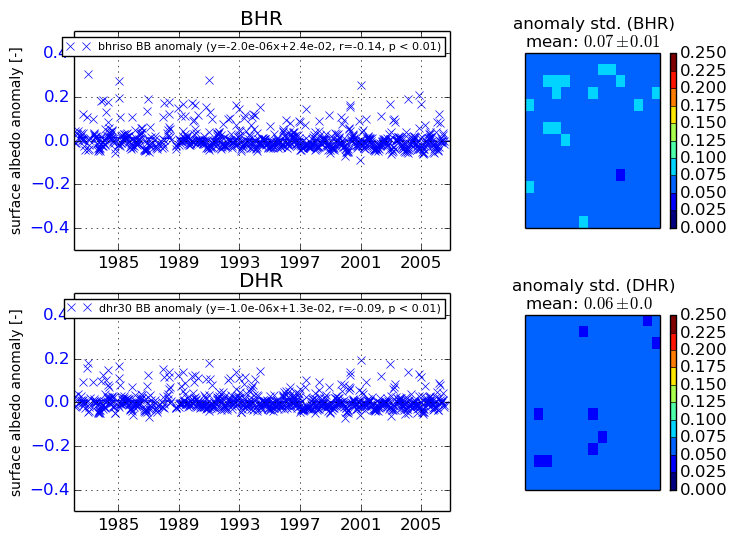
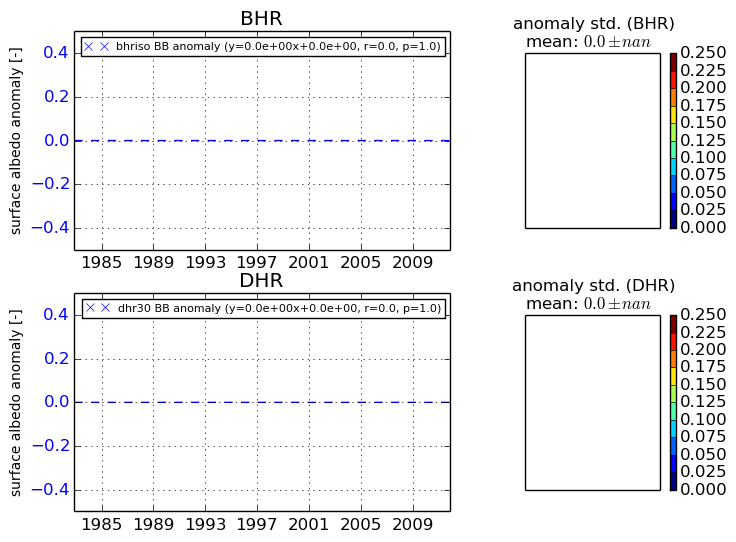
+000 deg


+057/+063 deg