WADI_ABU_GEIDUM


Location

lon / lat [deg]: 32.93 / 16.2

Source network: ALBEDOVAL1


Geostationary surface albedo (GSA) data


“+000”


“+057/+063”


Landcover information (based on ESA CCI landcover data)


Landcover fractions @ 2km distance


Landcover fractions @ 20 km distance


Legend


Distance to open water bodies [km]:

24.2

Distance to urban areas [km]:

25.29


Radius: 1 km

Number of landcover classes:

1

Dominant landcover type:

200: bare areas

Fraction of dominant landcover type [%]:

100.0


Radius: 2 km

Number of landcover classes:

1

Dominant landcover type:

200: bare areas

Fraction of dominant landcover type [%]:

99.0


Radius: 5 km

Number of landcover classes:

1

Dominant landcover type:

200: bare areas

Fraction of dominant landcover type [%]:

100.0


Radius: 10 km

Number of landcover classes:

3

Dominant landcover type:

200: bare areas

Fraction of dominant landcover type [%]:

92.0


Radius: 20 km

Number of landcover classes:

3

Dominant landcover type:

200: bare areas

Fraction of dominant landcover type [%]:

81.0


Disturbances


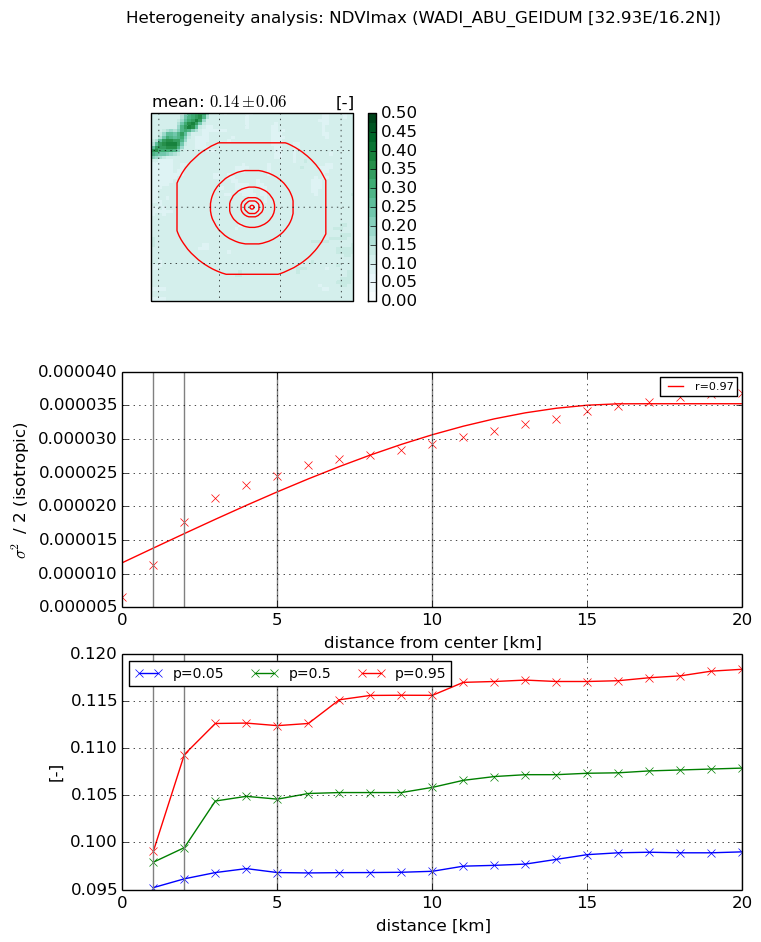
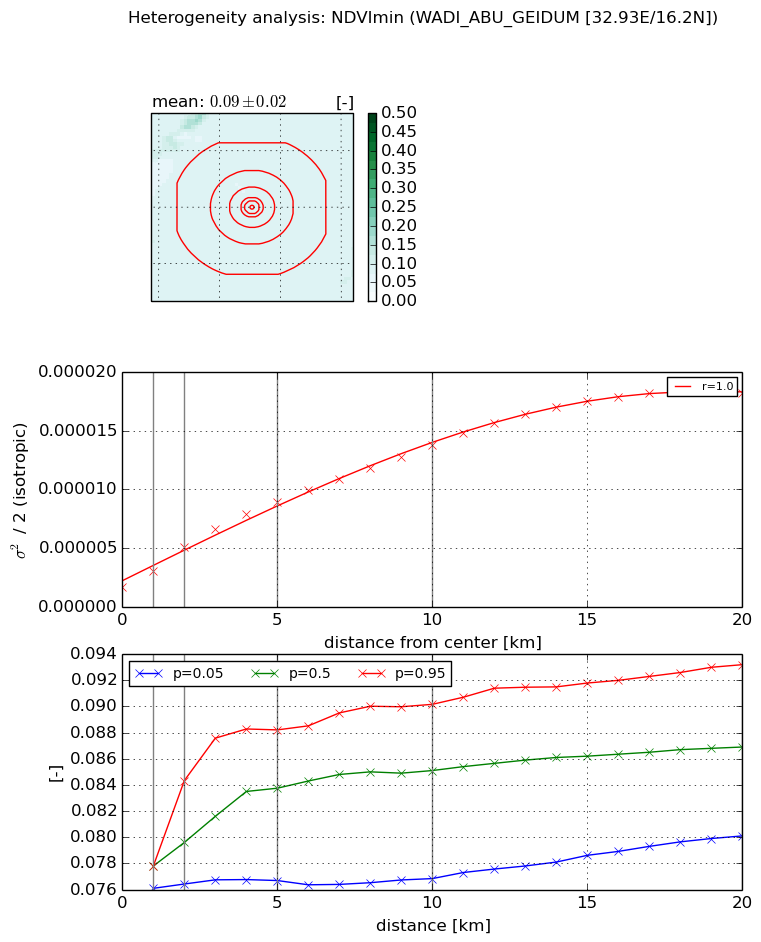
Heterogeneity analysis

The heterogeneity analysis provides information about the spatial and temporal heterogeneity of the site.

Topography


Roman et al. (2009) index


St

0.276101366329

Rcv

0.393618080778

Rse

0.0

Rst

3.83247191034e-05

Rsv

10.4719182198


Height range @ 1km [m]

11

Height range @ 2km [m]

18

Height range @ 5km [m]

33

Height range @ 10km [m]

-999

Height range @ 20km [m]

-999


Variance slope @ 1 km

9

Variance slope @ 2 km

13

Variance slope @ 5 km

21

Variance slope @ 10 km

-999

Variance slope @ 20 km

-999


NDVI (max. NDVI composite)


Roman et al. (2009) index


St

10.2727684844

Rcv

-0.0892277740065

Rse

0.0

Rst

0.0604405348905

Rsv

0.142365917762


NDVI range @ 1km [-]

0.0

NDVI range @ 2km [-]

0.01

NDVI range @ 5km [-]

0.02

NDVI range @ 10km [-]

0.02

NDVI range @ 20km [-]

0.02


Variance slope @ 1 km

4.80502753469e-06

Variance slope @ 2 km

5.59406702987e-06

Variance slope @ 5 km

3.68614530111e-06

Variance slope @ 10 km

2.06066894847e-06

Variance slope @ 20 km

1.23444794354e-06


NDVI (min. NDVI composite)I


Roman et al. (2009) index


St

3.1447176092

Rcv

0.0357460614903

Rse

0.0

Rst

-0.189572119438

Rsv

0.728662548924


NDVI range @ 1km [-]

0.0

NDVI range @ 2km [-]

0.01

NDVI range @ 5km [-]

0.01

NDVI range @ 10km [-]

0.01

NDVI range @ 20km [-]

0.01


NDVI slope @ 1 km

1.36588555393e-06

NDVI slope @ 2 km

1.69842907855e-06

NDVI slope @ 5 km

1.4831321896e-06

NDVI slope @ 10 km

1.17898462332e-06

NDVI slope @ 20 km

8.40077042995e-07


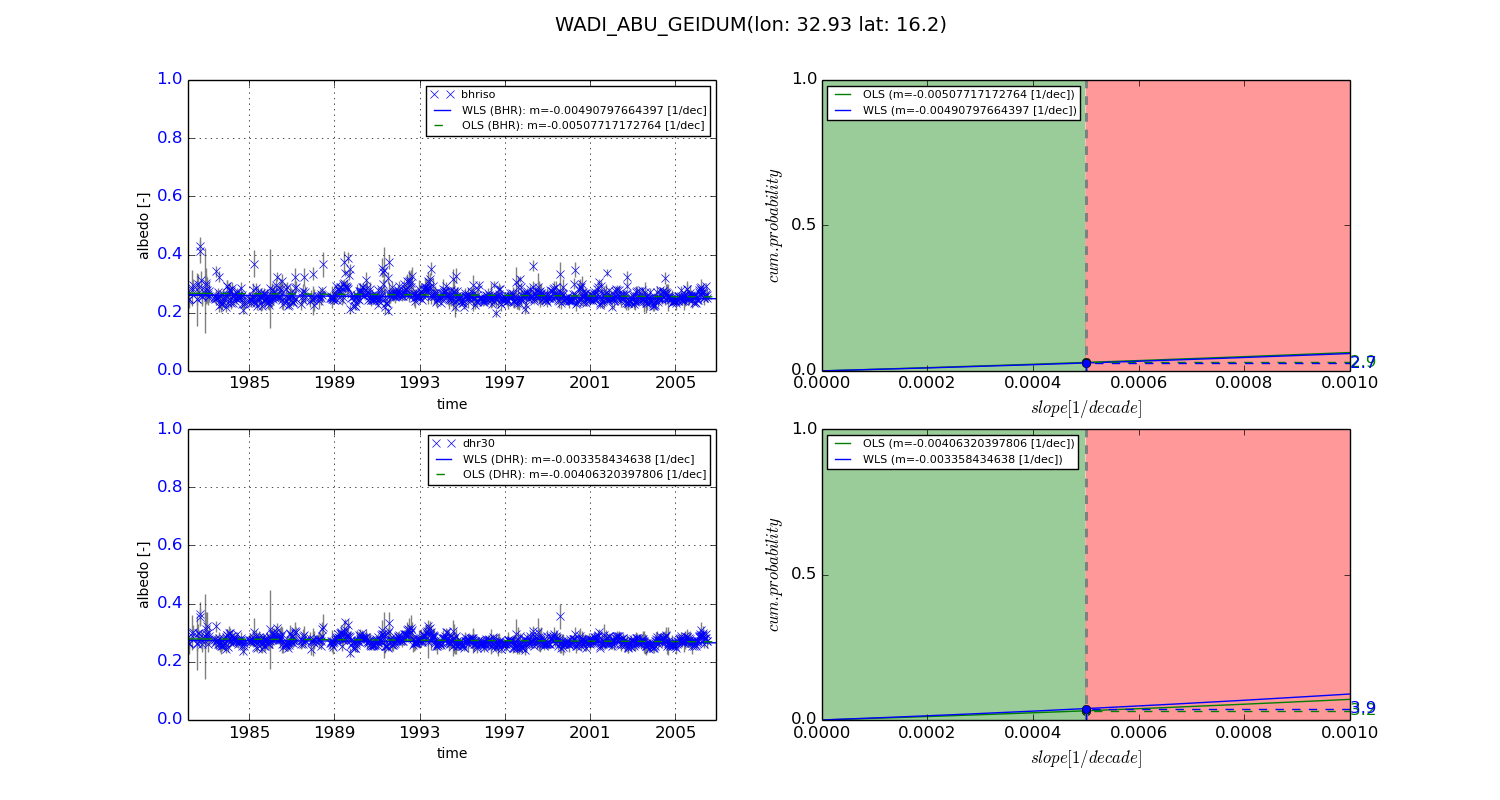
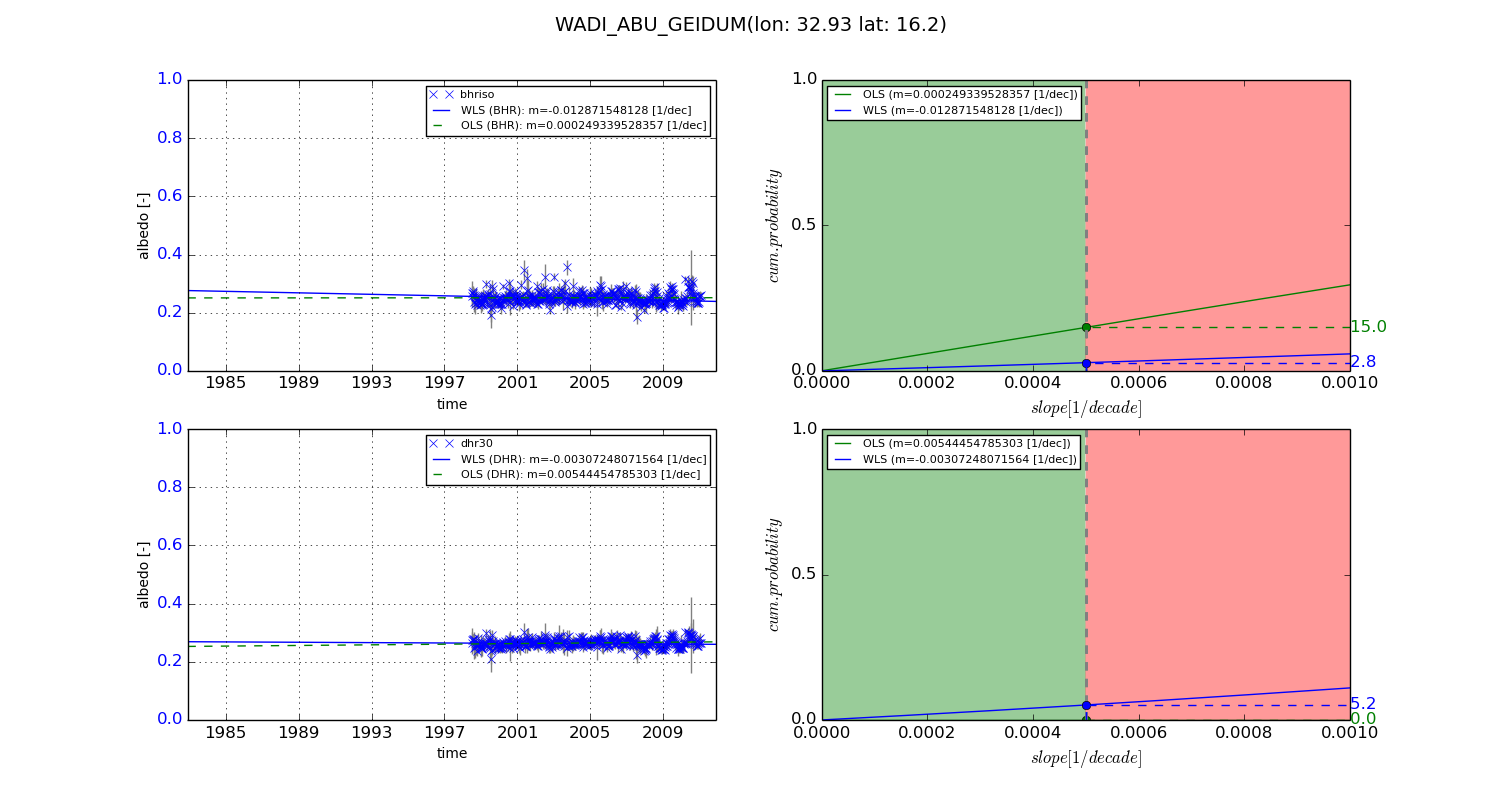
Temporal stability analysis

+000 deg (BHR)


BHR statistics

Temporal stability [1/decade]:


abs

rel


Weighted least square:

-0.00490797664397


Ordinary least square:

-0.00507717172764


Probabilities that GCOS criteria is met:

Weighted least square:

2.7 %

Ordinary least square:

2.9 %


DHR statistics

Temporal stability [1/decade]:


abs

rel


Weighted least square:

-0.003358434638


Ordinary least square:

-0.00406320397806


Probabilities that GCOS criteria is met:

Weighted least square:

3.9 %

Ordinary least square:

3.2 %


+057/+063 deg (BHR)


BHR statistics

Temporal stability [1/decade]:


abs

rel


Weighted least square:

-0.012871548128


Ordinary least square:

0.000249339528357


Probabilities that GCOS criteria is met:

Weighted least square:

2.8 %

Ordinary least square:

15.0 %


DHR statistics

Temporal stability [1/decade]:


abs

rel


Weighted least square:

-0.00307248071564


Ordinary least square:

0.00544454785303


Probabilities that GCOS criteria is met:

Weighted least square:

5.2 %

Ordinary least square:

0.0 %


Temporal anomaly analyis

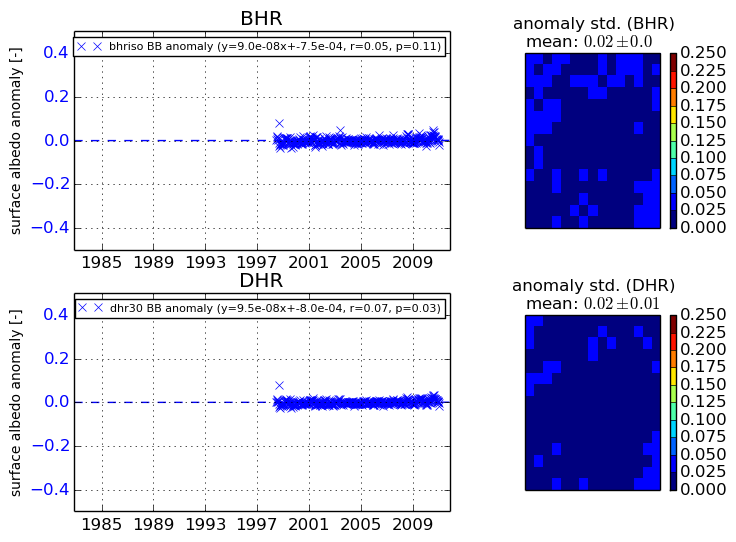
The variance of the temporal anomalies provides an additional measure about the stability of the signal AFTER removal of the mean seasonal cylce.
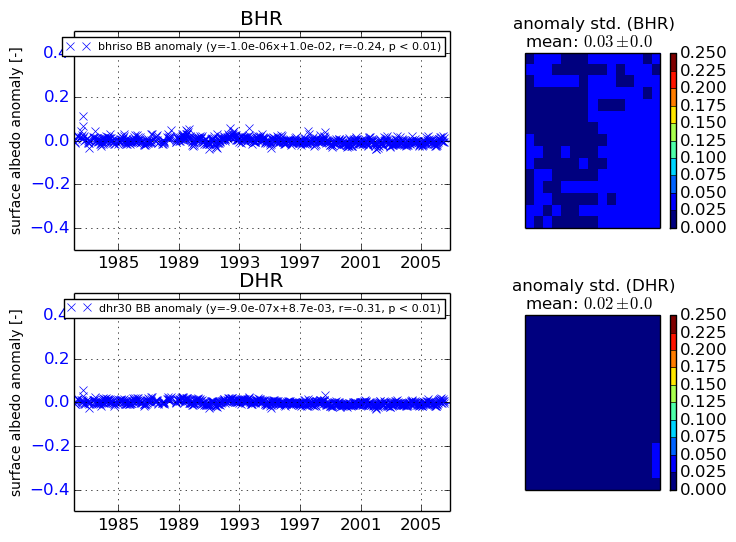
+000 deg


+057/+063 deg