WHITE_SANDS


Location

lon / lat [deg]: -106.351 / 32.919

Source network: AERONET


Geostationary surface albedo (GSA) data


“+000”


“+057/+063”


Landcover information (based on ESA CCI landcover data)


Landcover fractions @ 2km distance


Landcover fractions @ 20 km distance


Legend


Distance to open water bodies [km]:

0.11

Distance to urban areas [km]:

21.03


Radius: 1 km

Number of landcover classes:

1

Dominant landcover type:

210: water bodies

Fraction of dominant landcover type [%]:

100.0


Radius: 2 km

Number of landcover classes:

1

Dominant landcover type:

210: water bodies

Fraction of dominant landcover type [%]:

100.0


Radius: 5 km

Number of landcover classes:

3

Dominant landcover type:

210: water bodies

Fraction of dominant landcover type [%]:

92.0


Radius: 10 km

Number of landcover classes:

6

Dominant landcover type:

210: water bodies

Fraction of dominant landcover type [%]:

72.0


Radius: 20 km

Number of landcover classes:

8

Dominant landcover type:

120: Shrubland

Fraction of dominant landcover type [%]:

41.0


Disturbances


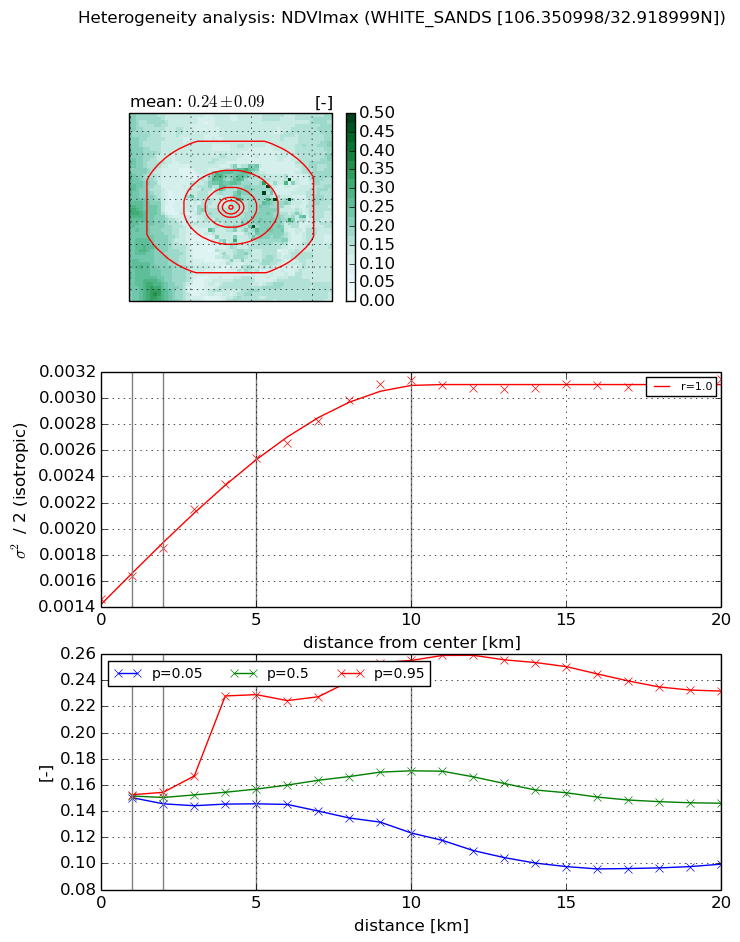
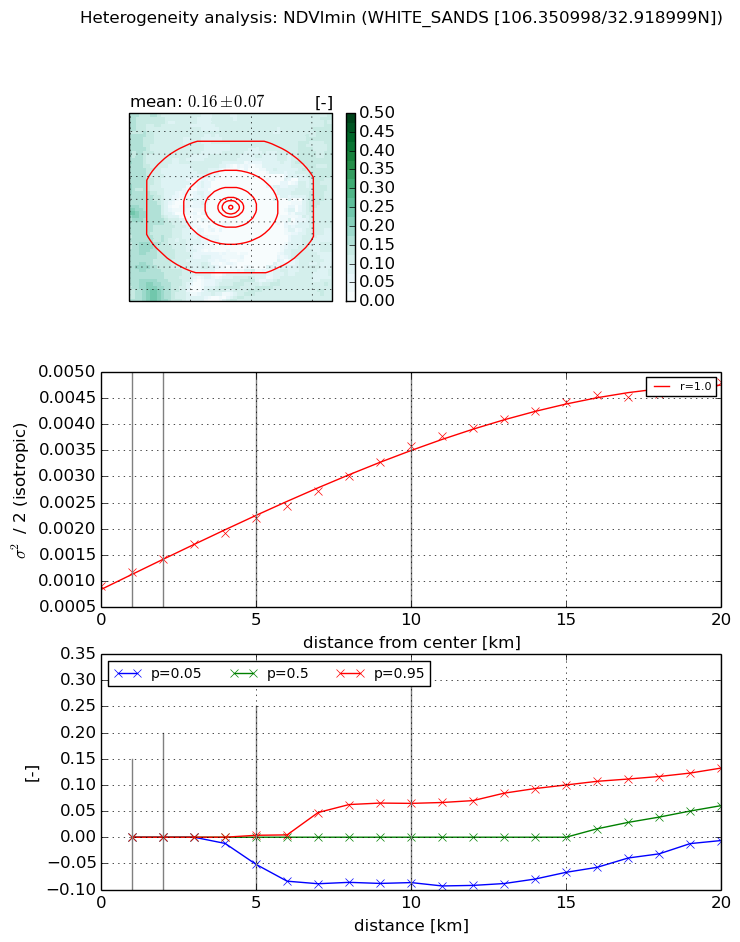
Heterogeneity analysis

The heterogeneity analysis provides information about the spatial and temporal heterogeneity of the site.

Topography


Roman et al. (2009) index


St

0.742757618523

Rcv

0.580547831928

Rse

0.0

Rst

2.40883576143e-08

Rsv

3.45845480809


Height range @ 1km [m]

6

Height range @ 2km [m]

7

Height range @ 5km [m]

15

Height range @ 10km [m]

-999

Height range @ 20km [m]

-999


Variance slope @ 1 km

3

Variance slope @ 2 km

4

Variance slope @ 5 km

6

Variance slope @ 10 km

-999

Variance slope @ 20 km

-999


NDVI (max. NDVI composite)


Roman et al. (2009) index


St

nan

Rcv

nan

Rse

nan

Rst

nan

Rsv

nan


NDVI range @ 1km [-]

0.0

NDVI range @ 2km [-]

0.01

NDVI range @ 5km [-]

0.08

NDVI range @ 10km [-]

0.13

NDVI range @ 20km [-]

0.13


Variance slope @ 1 km

0.000177141675262

Variance slope @ 2 km

0.000194847875396

Variance slope @ 5 km

0.000222663773172

Variance slope @ 10 km

0.000175758236205

Variance slope @ 20 km

7.35163834165e-05


NDVI (min. NDVI composite)I


Roman et al. (2009) index


St

8.51990467992e-08

Rcv

-1.84809290632

Rse

0.0

Rst

0.164876856291

Rsv

35211659.5338


NDVI range @ 1km [-]

0.0

NDVI range @ 2km [-]

0.0

NDVI range @ 5km [-]

0.06

NDVI range @ 10km [-]

0.15

NDVI range @ 20km [-]

0.14


NDVI slope @ 1 km

0.00027759380236

NDVI slope @ 2 km

0.000260051434211

NDVI slope @ 5 km

0.000258584188239

NDVI slope @ 10 km

0.000264409008513

NDVI slope @ 20 km

0.000203380408914


Temporal stability analysis

+000 deg (BHR)


BHR statistics

Temporal stability [1/decade]:


abs

rel


Weighted least square:

None


Ordinary least square:

None


Probabilities that GCOS criteria is met:

Weighted least square:

None %

Ordinary least square:

None %


DHR statistics

Temporal stability [1/decade]:


abs

rel


Weighted least square:

None


Ordinary least square:

None


Probabilities that GCOS criteria is met:

Weighted least square:

None %

Ordinary least square:

None %


+057/+063 deg (BHR)


BHR statistics

Temporal stability [1/decade]:


abs

rel


Weighted least square:

None


Ordinary least square:

None


Probabilities that GCOS criteria is met:

Weighted least square:

None %

Ordinary least square:

None %


DHR statistics

Temporal stability [1/decade]:


abs

rel


Weighted least square:

None


Ordinary least square:

None


Probabilities that GCOS criteria is met:

Weighted least square:

None %

Ordinary least square:

None %


Temporal anomaly analyis

The variance of the temporal anomalies provides an additional measure about the stability of the signal AFTER removal of the mean seasonal cylce.

+000 deg


+057/+063 deg