WINDSOR_B


Location

lon / lat [deg]: -83.083 / 42.283

Source network: AERONET


Geostationary surface albedo (GSA) data


“+000”


“+057/+063”


Landcover information (based on ESA CCI landcover data)


Landcover fractions @ 2km distance


Landcover fractions @ 20 km distance


Legend


Distance to open water bodies [km]:

1.07

Distance to urban areas [km]:

0.15


Radius: 1 km

Number of landcover classes:

4

Dominant landcover type:

190: urban areas

Fraction of dominant landcover type [%]:

63.0


Radius: 2 km

Number of landcover classes:

8

Dominant landcover type:

190: urban areas

Fraction of dominant landcover type [%]:

51.0


Radius: 5 km

Number of landcover classes:

7

Dominant landcover type:

190: urban areas

Fraction of dominant landcover type [%]:

71.0


Radius: 10 km

Number of landcover classes:

6

Dominant landcover type:

190: urban areas

Fraction of dominant landcover type [%]:

75.0


Radius: 20 km

Number of landcover classes:

4

Dominant landcover type:

190: urban areas

Fraction of dominant landcover type [%]:

67.0


Disturbances


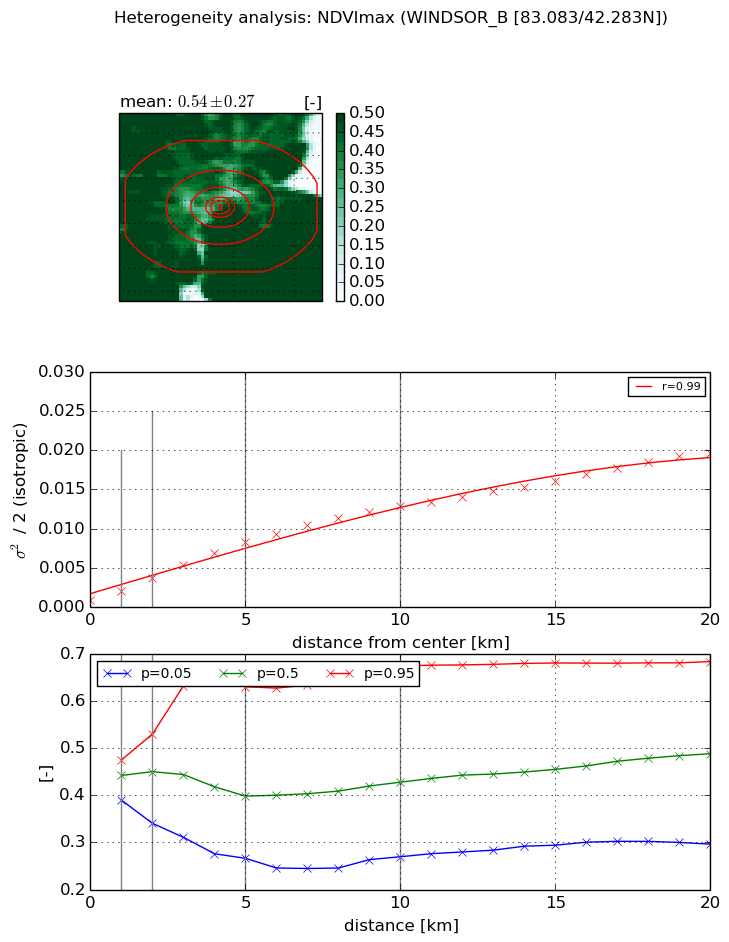
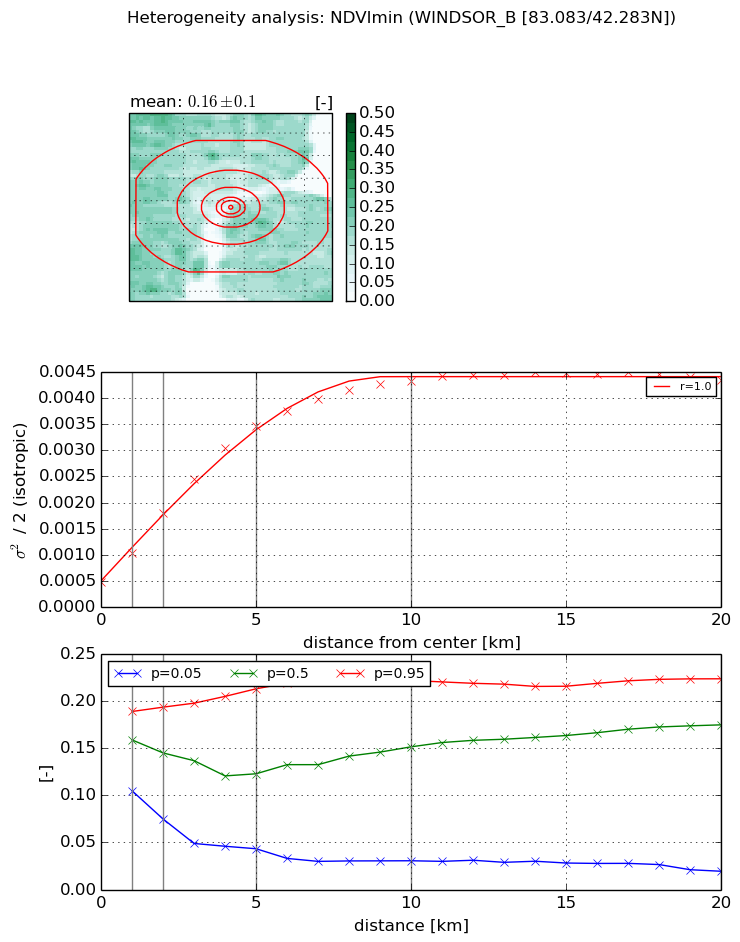
Heterogeneity analysis

The heterogeneity analysis provides information about the spatial and temporal heterogeneity of the site.

Topography


Roman et al. (2009) index


St

2.46984634997

Rcv

-0.0677657687938

Rse

0.0

Rst

0.00786143833356

Rsv

1.1390232508


Height range @ 1km [m]

6

Height range @ 2km [m]

12

Height range @ 5km [m]

13

Height range @ 10km [m]

-999

Height range @ 20km [m]

-999


Variance slope @ 1 km

9

Variance slope @ 2 km

5

Variance slope @ 5 km

3

Variance slope @ 10 km

-999

Variance slope @ 20 km

-999


NDVI (max. NDVI composite)


Roman et al. (2009) index


St

2.05269594789e-08

Rcv

0.256083315294

Rse

0.0

Rst

0.280764144258

Rsv

146149262.489


NDVI range @ 1km [-]

0.09

NDVI range @ 2km [-]

0.19

NDVI range @ 5km [-]

0.36

NDVI range @ 10km [-]

0.41

NDVI range @ 20km [-]

0.39


Variance slope @ 1 km

0.00114714750323

Variance slope @ 2 km

0.00140849504403

Variance slope @ 5 km

0.00149926141199

Variance slope @ 10 km

0.00123030105848

Variance slope @ 20 km

0.000893863423343


NDVI (min. NDVI composite)I


Roman et al. (2009) index


St

10.3435619635

Rcv

0.0859381872603

Rse

0.0

Rst

-0.074058113412

Rsv

0.130039183293


NDVI range @ 1km [-]

0.08

NDVI range @ 2km [-]

0.12

NDVI range @ 5km [-]

0.17

NDVI range @ 10km [-]

0.19

NDVI range @ 20km [-]

0.2


NDVI slope @ 1 km

0.000539349350819

NDVI slope @ 2 km

0.000652039059549

NDVI slope @ 5 km

0.000617212592905

NDVI slope @ 10 km

0.000391415673623

NDVI slope @ 20 km

0.000160087316892


Temporal stability analysis

+000 deg (BHR)


BHR statistics

Temporal stability [1/decade]:


abs

rel


Weighted least square:

None


Ordinary least square:

None


Probabilities that GCOS criteria is met:

Weighted least square:

None %

Ordinary least square:

None %


DHR statistics

Temporal stability [1/decade]:


abs

rel


Weighted least square:

None


Ordinary least square:

None


Probabilities that GCOS criteria is met:

Weighted least square:

None %

Ordinary least square:

None %


+057/+063 deg (BHR)


BHR statistics

Temporal stability [1/decade]:


abs

rel


Weighted least square:

None


Ordinary least square:

None


Probabilities that GCOS criteria is met:

Weighted least square:

None %

Ordinary least square:

None %


DHR statistics

Temporal stability [1/decade]:


abs

rel


Weighted least square:

None


Ordinary least square:

None


Probabilities that GCOS criteria is met:

Weighted least square:

None %

Ordinary least square:

None %


Temporal anomaly analyis

The variance of the temporal anomalies provides an additional measure about the stability of the signal AFTER removal of the mean seasonal cylce.

+000 deg


+057/+063 deg