YUFA_PEK


Location

lon / lat [deg]: 116.184 / 39.309

Source network: AERONET


Geostationary surface albedo (GSA) data


“+000”


“+057/+063”


Landcover information (based on ESA CCI landcover data)


Landcover fractions @ 2km distance


Landcover fractions @ 20 km distance


Legend


Distance to open water bodies [km]:

26.37

Distance to urban areas [km]:

0.93


Radius: 1 km

Number of landcover classes:

3

Dominant landcover type:

10: cropland, rainfed

Fraction of dominant landcover type [%]:

95.0


Radius: 2 km

Number of landcover classes:

3

Dominant landcover type:

10: cropland, rainfed

Fraction of dominant landcover type [%]:

80.0


Radius: 5 km

Number of landcover classes:

3

Dominant landcover type:

10: cropland, rainfed

Fraction of dominant landcover type [%]:

84.0


Radius: 10 km

Number of landcover classes:

3

Dominant landcover type:

10: cropland, rainfed

Fraction of dominant landcover type [%]:

85.0


Radius: 20 km

Number of landcover classes:

3

Dominant landcover type:

10: cropland, rainfed

Fraction of dominant landcover type [%]:

81.0


Disturbances


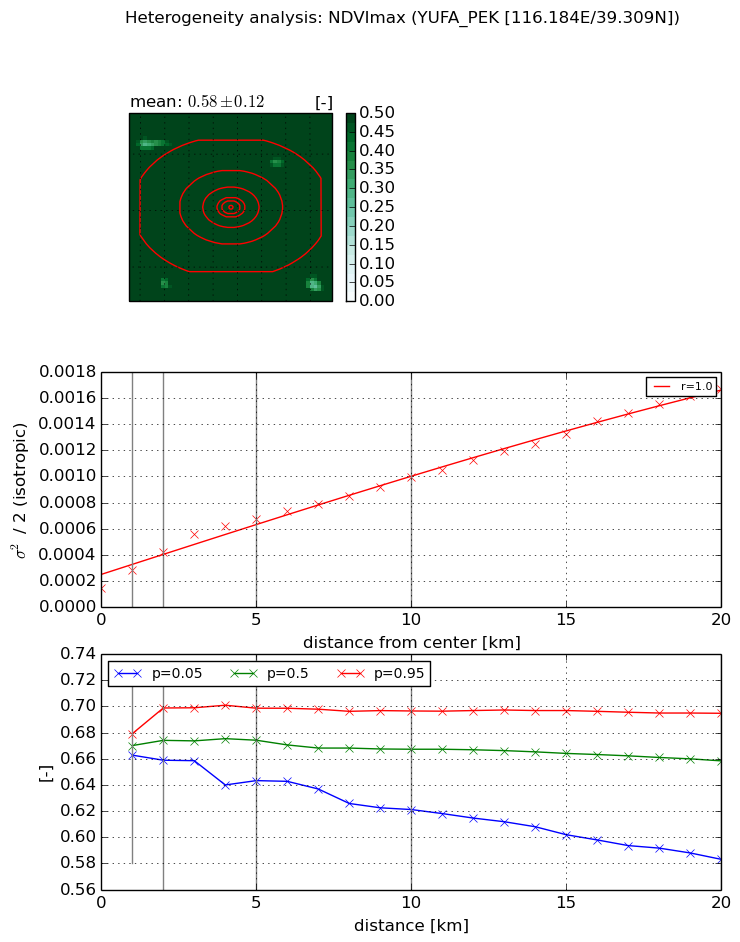
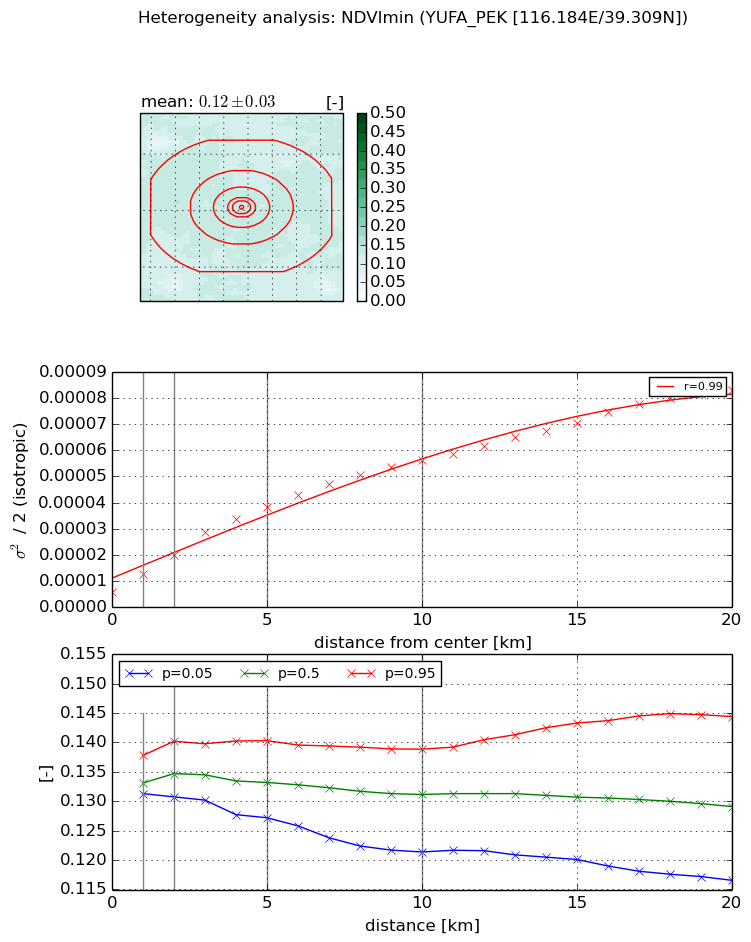
Heterogeneity analysis

The heterogeneity analysis provides information about the spatial and temporal heterogeneity of the site.

Topography


Roman et al. (2009) index


St

5.6870105035e-06

Rcv

0.145170605475

Rse

0.0

Rst

-0.300956054333

Rsv

527517.482345


Height range @ 1km [m]

5

Height range @ 2km [m]

5

Height range @ 5km [m]

6

Height range @ 10km [m]

-999

Height range @ 20km [m]

-999


Variance slope @ 1 km

1

Variance slope @ 2 km

0

Variance slope @ 5 km

0

Variance slope @ 10 km

-999

Variance slope @ 20 km

-999


NDVI (max. NDVI composite)


Roman et al. (2009) index


St

13.628601727

Rcv

0.197461028945

Rse

0.0

Rst

0.000333451522673

Rsv

0.0223308163233


NDVI range @ 1km [-]

0.02

NDVI range @ 2km [-]

0.04

NDVI range @ 5km [-]

0.06

NDVI range @ 10km [-]

0.08

NDVI range @ 20km [-]

0.11


Variance slope @ 1 km

0.000142075299508

Variance slope @ 2 km

0.000139015471439

Variance slope @ 5 km

0.000108295749464

Variance slope @ 10 km

7.84777213989e-05

Variance slope @ 20 km

7.10395160436e-05


NDVI (min. NDVI composite)I


Roman et al. (2009) index


St

4.1035157169

Rcv

0.370372667743

Rse

0.0

Rst

-0.0802404910098

Rsv

0.280467262762


NDVI range @ 1km [-]

0.01

NDVI range @ 2km [-]

0.01

NDVI range @ 5km [-]

0.01

NDVI range @ 10km [-]

0.02

NDVI range @ 20km [-]

0.03


NDVI slope @ 1 km

6.83989870005e-06

NDVI slope @ 2 km

7.01487856484e-06

NDVI slope @ 5 km

6.67452165173e-06

NDVI slope @ 10 km

5.01077219295e-06

NDVI slope @ 20 km

3.63792699569e-06


Temporal stability analysis

+000 deg (BHR)


BHR statistics

Temporal stability [1/decade]:


abs

rel


Weighted least square:

None


Ordinary least square:

None


Probabilities that GCOS criteria is met:

Weighted least square:

None %

Ordinary least square:

None %


DHR statistics

Temporal stability [1/decade]:


abs

rel


Weighted least square:

None


Ordinary least square:

None


Probabilities that GCOS criteria is met:

Weighted least square:

None %

Ordinary least square:

None %


+057/+063 deg (BHR)


BHR statistics

Temporal stability [1/decade]:


abs

rel


Weighted least square:

-99999.0


Ordinary least square:

-99999.0


Probabilities that GCOS criteria is met:

Weighted least square:

-99999.0 %

Ordinary least square:

-99999.0 %


DHR statistics

Temporal stability [1/decade]:


abs

rel


Weighted least square:

-99999.0


Ordinary least square:

-99999.0


Probabilities that GCOS criteria is met:

Weighted least square:

-99999.0 %

Ordinary least square:

-99999.0 %


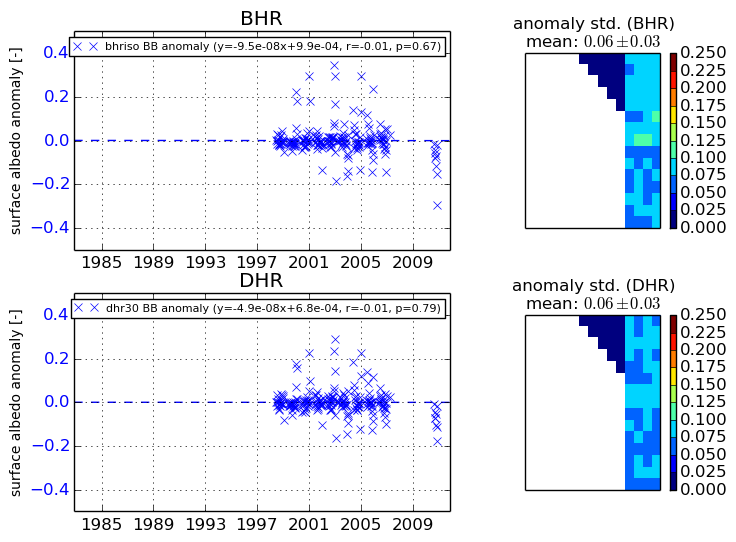
Temporal anomaly analyis

The variance of the temporal anomalies provides an additional measure about the stability of the signal AFTER removal of the mean seasonal cylce.

+000 deg


+057/+063 deg