ZVE


Location

lon / lat [deg]: 36.7754 / 55.6958

Source network: BSRN


Geostationary surface albedo (GSA) data


“+000”


“+057/+063”


Landcover information (based on ESA CCI landcover data)


Landcover fractions @ 2km distance


Landcover fractions @ 20 km distance


Legend


Distance to open water bodies [km]:

0.87

Distance to urban areas [km]:

5.68


Radius: 1 km

Number of landcover classes:

7

Dominant landcover type:

70: Tree cover, needleleaved, evergreen, closed to open (>15%)

Fraction of dominant landcover type [%]:

48.0


Radius: 2 km

Number of landcover classes:

7

Dominant landcover type:

70: Tree cover, needleleaved, evergreen, closed to open (>15%)

Fraction of dominant landcover type [%]:

35.0


Radius: 5 km

Number of landcover classes:

6

Dominant landcover type:

70: Tree cover, needleleaved, evergreen, closed to open (>15%)

Fraction of dominant landcover type [%]:

34.0


Radius: 10 km

Number of landcover classes:

7

Dominant landcover type:

70: Tree cover, needleleaved, evergreen, closed to open (>15%)

Fraction of dominant landcover type [%]:

32.0


Radius: 20 km

Number of landcover classes:

8

Dominant landcover type:

90: Tree cover, mixed leaf type

Fraction of dominant landcover type [%]:

36.0


Disturbances


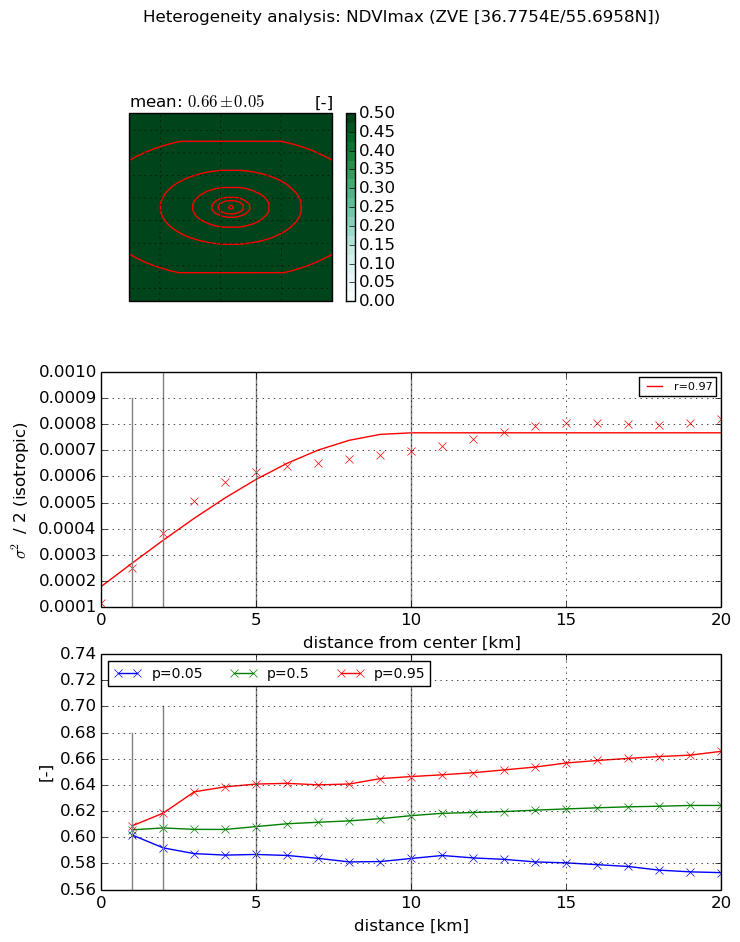
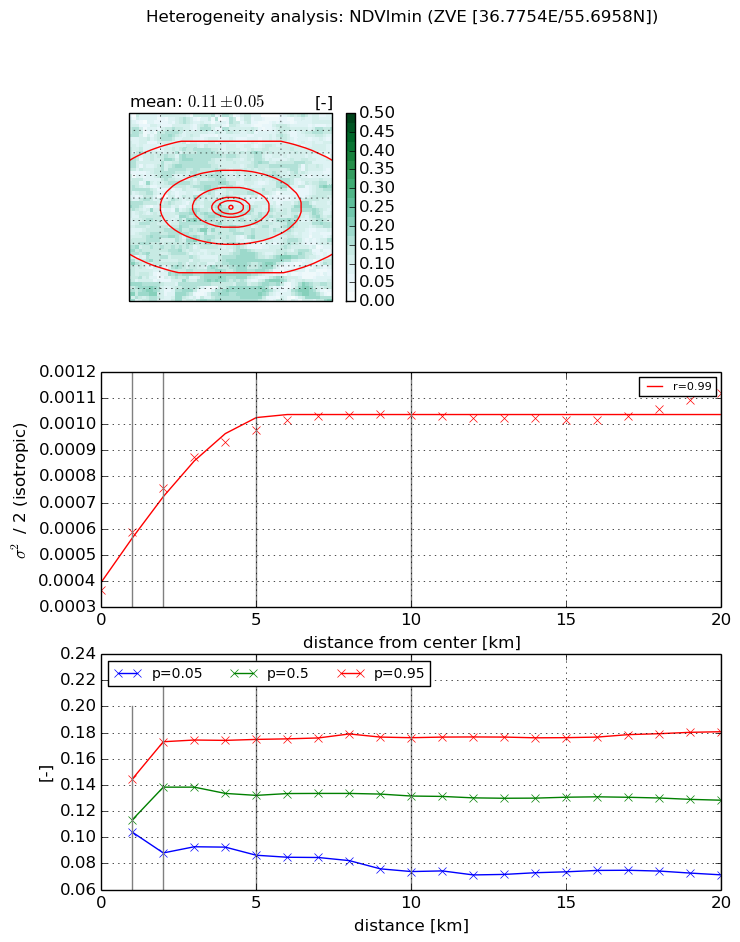
Heterogeneity analysis

The heterogeneity analysis provides information about the spatial and temporal heterogeneity of the site.

Topography


Roman et al. (2009) index


St

13.5632363943

Rcv

-0.0496556700984

Rse

0.0

Rst

-0.0493553086075

Rsv

-0.122175168374


Height range @ 1km [m]

48

Height range @ 2km [m]

62

Height range @ 5km [m]

68

Height range @ 10km [m]

-999

Height range @ 20km [m]

-999


Variance slope @ 1 km

195

Variance slope @ 2 km

192

Variance slope @ 5 km

116

Variance slope @ 10 km

-999

Variance slope @ 20 km

-999


NDVI (max. NDVI composite)


Roman et al. (2009) index


St

nan

Rcv

nan

Rse

nan

Rst

nan

Rsv

nan


NDVI range @ 1km [-]

0.01

NDVI range @ 2km [-]

0.03

NDVI range @ 5km [-]

0.05

NDVI range @ 10km [-]

0.06

NDVI range @ 20km [-]

0.09


Variance slope @ 1 km

0.000133730400189

Variance slope @ 2 km

0.00013351637622

Variance slope @ 5 km

0.000103133351351

Variance slope @ 10 km

5.30012054779e-05

Variance slope @ 20 km

2.70092357769e-05


NDVI (min. NDVI composite)I


Roman et al. (2009) index


St

1.32199997854

Rcv

0.125647122244

Rse

0.0

Rst

-0.308503276571

Rsv

1.83513859414


NDVI range @ 1km [-]

0.04

NDVI range @ 2km [-]

0.09

NDVI range @ 5km [-]

0.09

NDVI range @ 10km [-]

0.1

NDVI range @ 20km [-]

0.11


NDVI slope @ 1 km

0.000222264591631

NDVI slope @ 2 km

0.000196151661795

NDVI slope @ 5 km

0.000121048780817

NDVI slope @ 10 km

5.83346102526e-05

NDVI slope @ 20 km

2.11406404279e-05


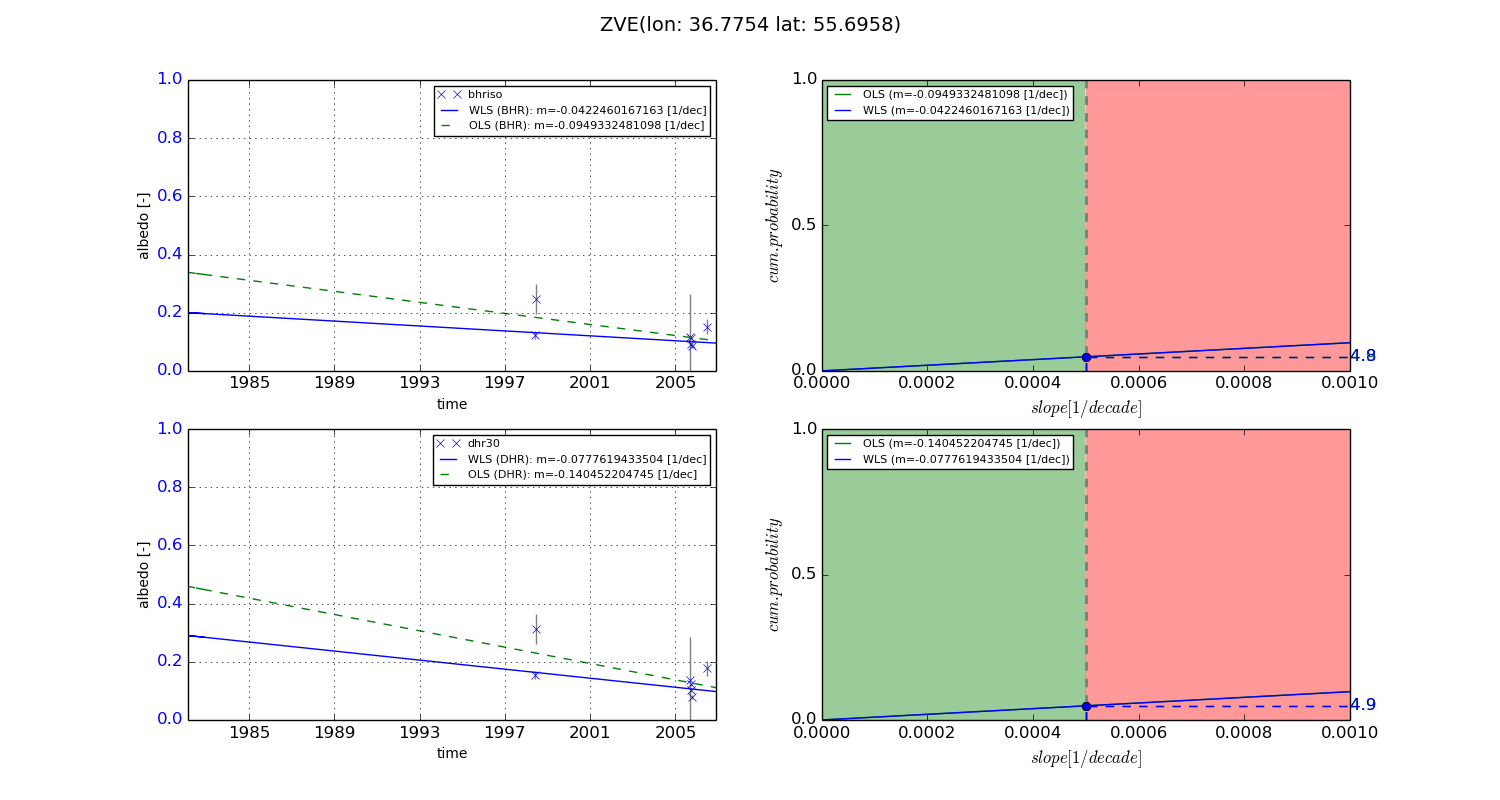
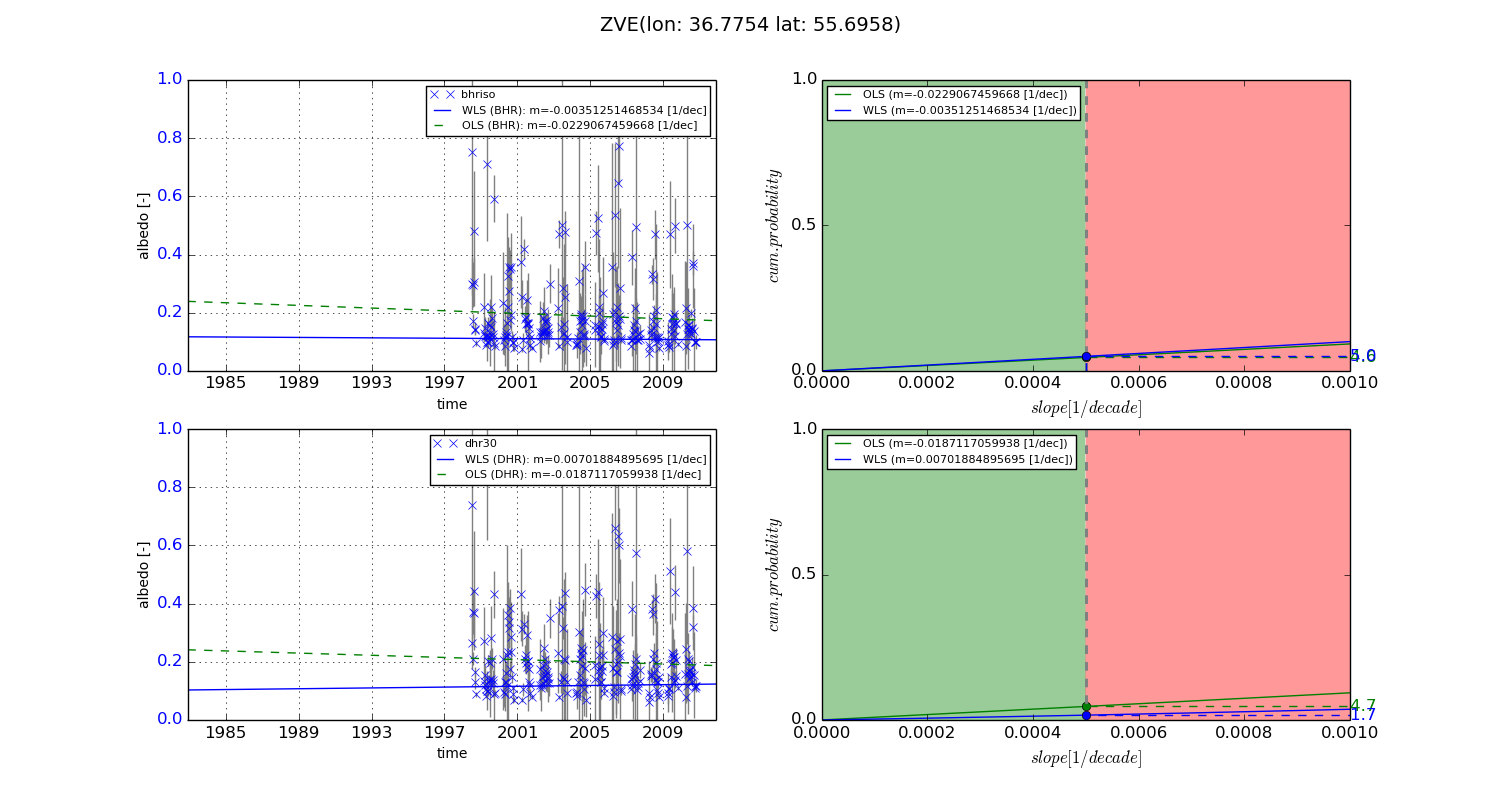
Temporal stability analysis

+000 deg (BHR)


BHR statistics

Temporal stability [1/decade]:


abs

rel


Weighted least square:

-0.0422460167163


Ordinary least square:

-0.0949332481098


Probabilities that GCOS criteria is met:

Weighted least square:

4.8 %

Ordinary least square:

4.9 %


DHR statistics

Temporal stability [1/decade]:


abs

rel


Weighted least square:

-0.0777619433504


Ordinary least square:

-0.140452204745


Probabilities that GCOS criteria is met:

Weighted least square:

4.9 %

Ordinary least square:

4.9 %


+057/+063 deg (BHR)


BHR statistics

Temporal stability [1/decade]:


abs

rel


Weighted least square:

-0.00351251468534


Ordinary least square:

-0.0229067459668


Probabilities that GCOS criteria is met:

Weighted least square:

5.0 %

Ordinary least square:

4.6 %


DHR statistics

Temporal stability [1/decade]:


abs

rel


Weighted least square:

0.00701884895695


Ordinary least square:

-0.0187117059938


Probabilities that GCOS criteria is met:

Weighted least square:

1.7 %

Ordinary least square:

4.7 %


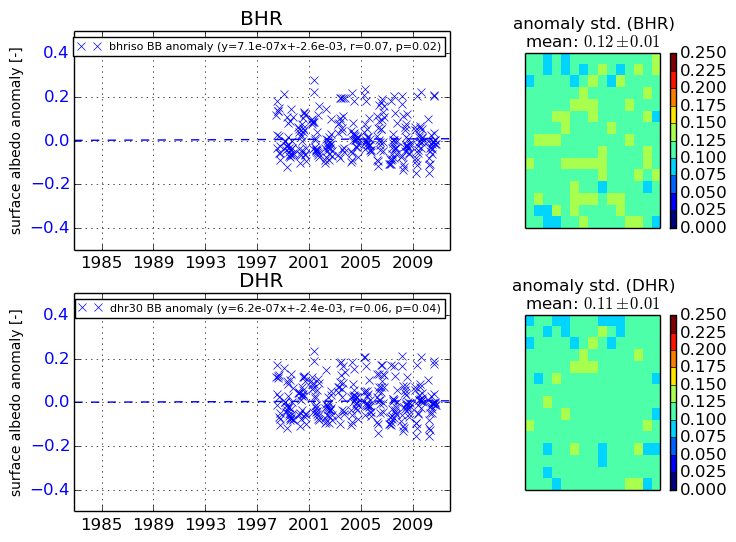
Temporal anomaly analyis

The variance of the temporal anomalies provides an additional measure about the stability of the signal AFTER removal of the mean seasonal cylce.
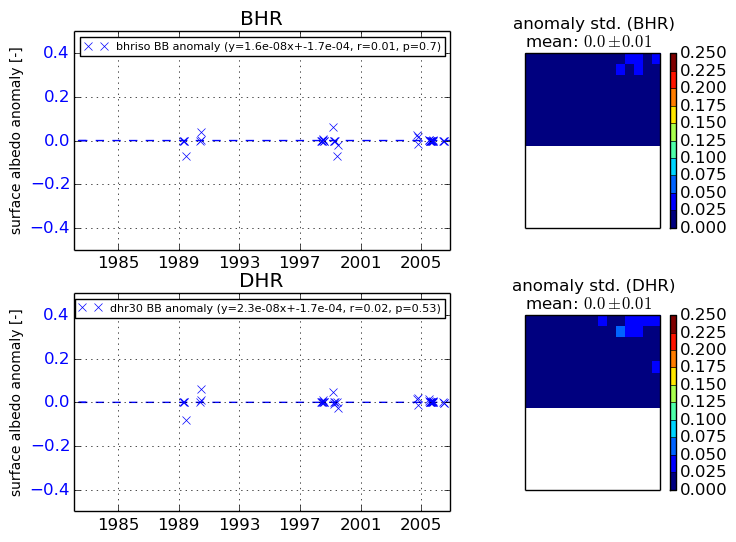
+000 deg


+057/+063 deg