ADAMOWKA


Location

lon / lat [deg]: 59.75 / 51.75

Source network: ALBEDOVAL2


Geostationary surface albedo (GSA) data


“+000”


“+057/+063”


Landcover information (based on ESA CCI landcover data)


Landcover fractions @ 2km distance


Landcover fractions @ 20 km distance


Legend


Distance to open water bodies [km]:

16.0

Distance to urban areas [km]:

6.37


Radius: 1 km

Number of landcover classes:

3

Dominant landcover type:

10: cropland, rainfed

Fraction of dominant landcover type [%]:

77.0


Radius: 2 km

Number of landcover classes:

2

Dominant landcover type:

10: cropland, rainfed

Fraction of dominant landcover type [%]:

93.0


Radius: 5 km

Number of landcover classes:

3

Dominant landcover type:

10: cropland, rainfed

Fraction of dominant landcover type [%]:

76.0


Radius: 10 km

Number of landcover classes:

5

Dominant landcover type:

10: cropland, rainfed

Fraction of dominant landcover type [%]:

67.0


Radius: 20 km

Number of landcover classes:

3

Dominant landcover type:

10: cropland, rainfed

Fraction of dominant landcover type [%]:

69.0


Disturbances


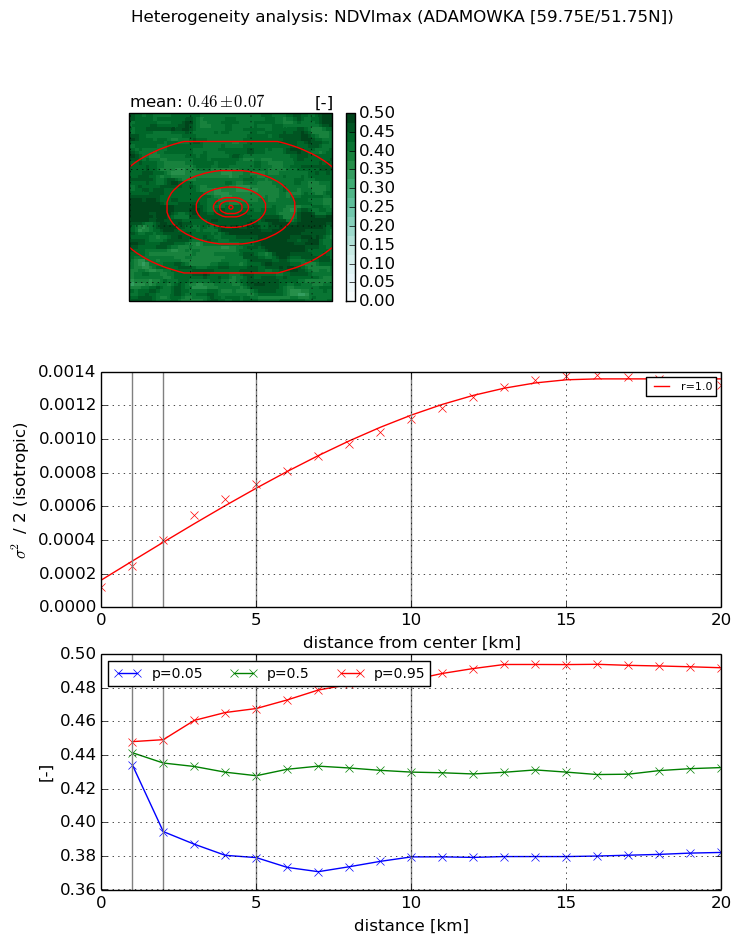
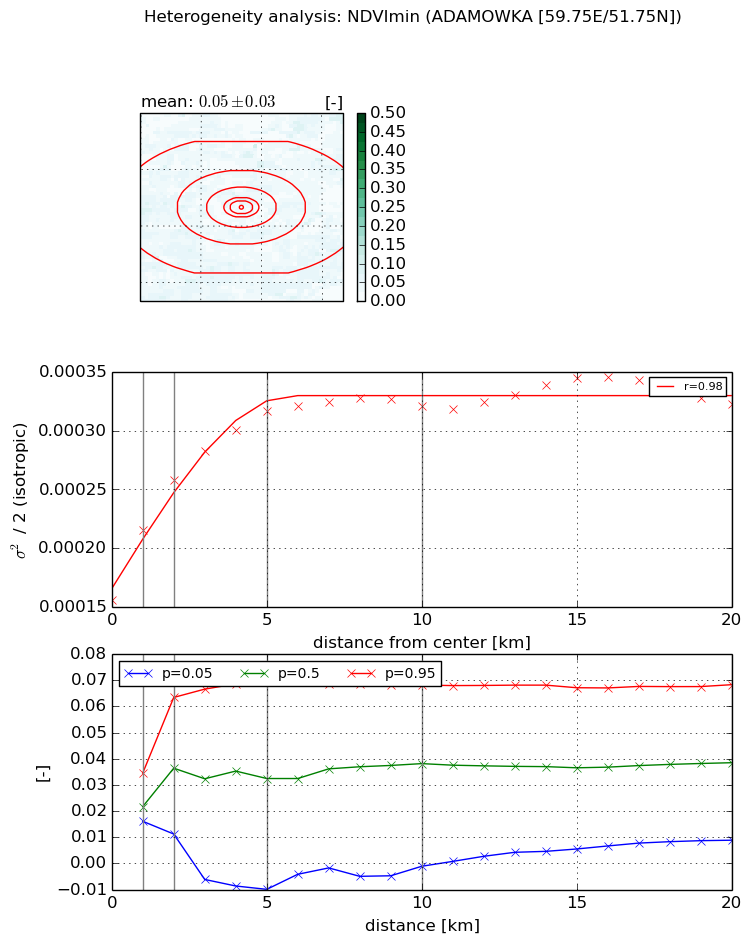
Heterogeneity analysis

The heterogeneity analysis provides information about the spatial and temporal heterogeneity of the site.

Topography


Roman et al. (2009) index


St

3.48740060976

Rcv

0.265456676062

Rse

0.0

Rst

5.787680324e-06

Rsv

0.594777105982


Height range @ 1km [m]

30

Height range @ 2km [m]

37

Height range @ 5km [m]

58

Height range @ 10km [m]

-999

Height range @ 20km [m]

-999


Variance slope @ 1 km

39

Variance slope @ 2 km

49

Variance slope @ 5 km

68

Variance slope @ 10 km

-999

Variance slope @ 20 km

-999


NDVI (max. NDVI composite)


Roman et al. (2009) index


St

1.28030599229

Rcv

0.26144231201

Rse

0.0

Rst

3.74153505311e-09

Rsv

2.08174752953


NDVI range @ 1km [-]

0.01

NDVI range @ 2km [-]

0.05

NDVI range @ 5km [-]

0.09

NDVI range @ 10km [-]

0.11

NDVI range @ 20km [-]

0.11


Variance slope @ 1 km

0.000125662587654

Variance slope @ 2 km

0.000141792416306

Variance slope @ 5 km

0.00012597948697

Variance slope @ 10 km

9.80966532084e-05

Variance slope @ 20 km

6.11437147507e-05


NDVI (min. NDVI composite)I


Roman et al. (2009) index


St

2.22060940827

Rcv

0.0382307001382

Rse

0.0

Rst

-0.64115196739

Rsv

0.671597828558


NDVI range @ 1km [-]

0.02

NDVI range @ 2km [-]

0.05

NDVI range @ 5km [-]

0.08

NDVI range @ 10km [-]

0.07

NDVI range @ 20km [-]

0.06


NDVI slope @ 1 km

5.93653556653e-05

NDVI slope @ 2 km

5.11723972971e-05

NDVI slope @ 5 km

3.09912837362e-05

NDVI slope @ 10 km

1.44116813444e-05

NDVI slope @ 20 km

5.47544852534e-06


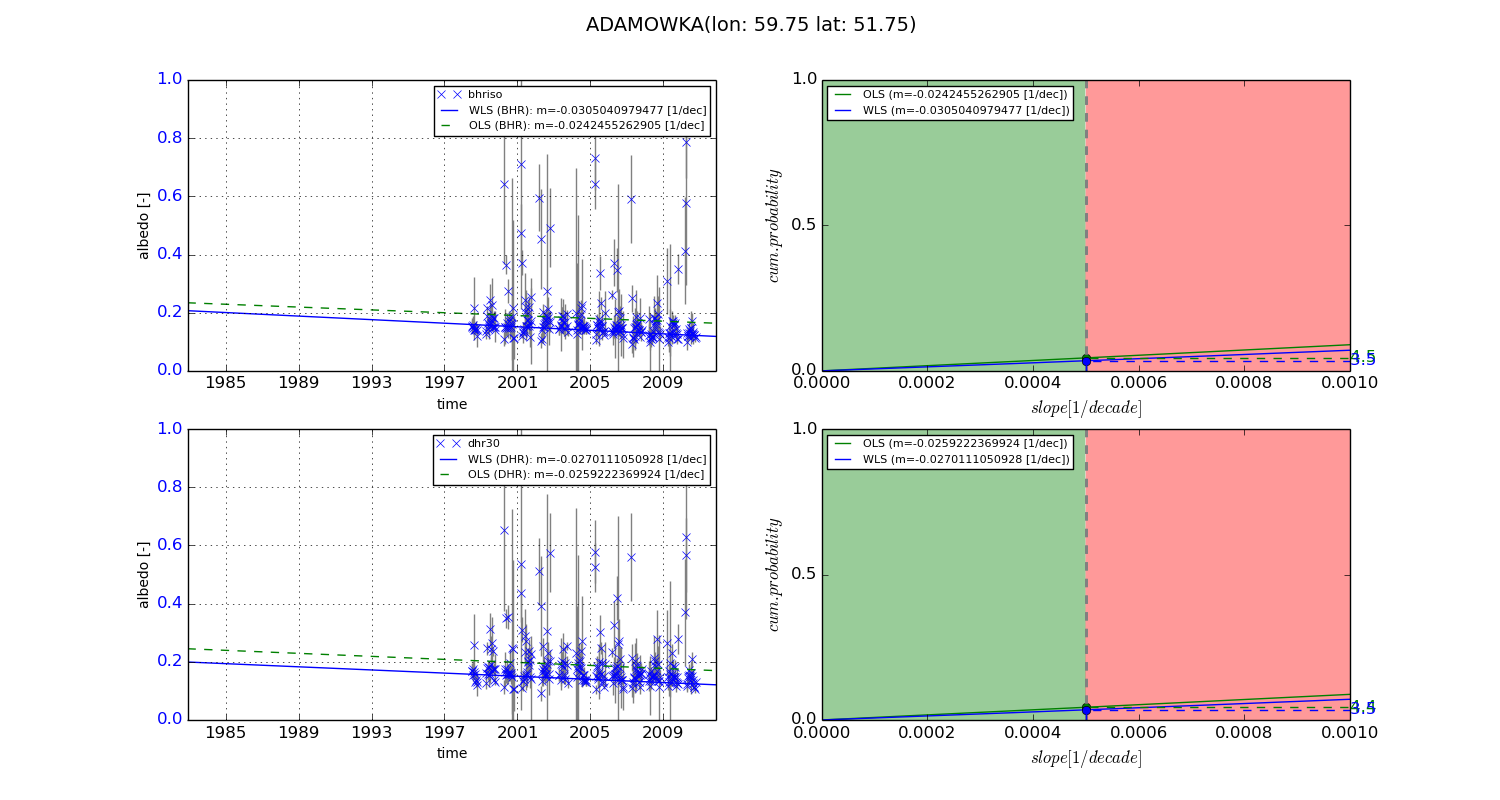
Temporal stability analysis

+000 deg (BHR)


BHR statistics

Temporal stability [1/decade]:


abs

rel


Weighted least square:

-99999.0


Ordinary least square:

-99999.0


Probabilities that GCOS criteria is met:

Weighted least square:

-99999.0 %

Ordinary least square:

-99999.0 %


DHR statistics

Temporal stability [1/decade]:


abs

rel


Weighted least square:

-99999.0


Ordinary least square:

-99999.0


Probabilities that GCOS criteria is met:

Weighted least square:

-99999.0 %

Ordinary least square:

-99999.0 %


+057/+063 deg (BHR)


BHR statistics

Temporal stability [1/decade]:


abs

rel


Weighted least square:

-0.0305040979477


Ordinary least square:

-0.0242455262905


Probabilities that GCOS criteria is met:

Weighted least square:

3.5 %

Ordinary least square:

4.5 %


DHR statistics

Temporal stability [1/decade]:


abs

rel


Weighted least square:

-0.0270111050928


Ordinary least square:

-0.0259222369924


Probabilities that GCOS criteria is met:

Weighted least square:

3.5 %

Ordinary least square:

4.4 %


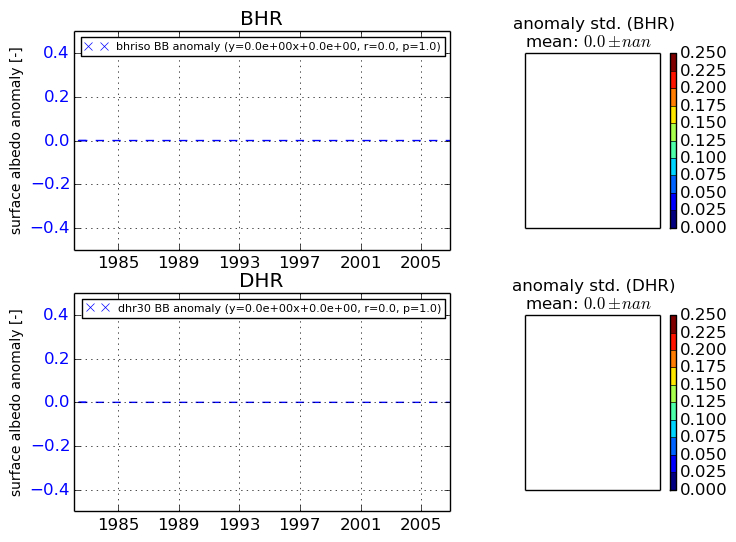
Temporal anomaly analyis

The variance of the temporal anomalies provides an additional measure about the stability of the signal AFTER removal of the mean seasonal cylce.
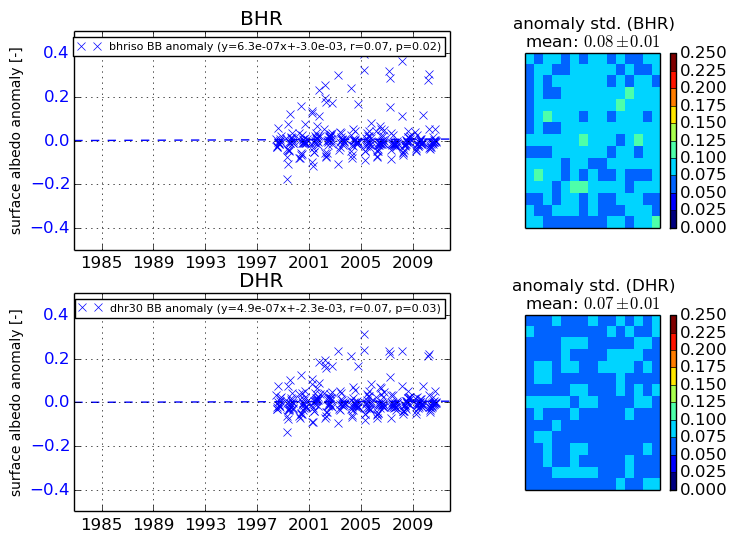
+000 deg


+057/+063 deg