AGOUFOU


Location

lon / lat [deg]: -1.4791 / 15.3454

Source network: AERONET


Geostationary surface albedo (GSA) data


“+000”


“+057/+063”


Landcover information (based on ESA CCI landcover data)


Landcover fractions @ 2km distance


Landcover fractions @ 20 km distance


Legend


Distance to open water bodies [km]:

2.42

Distance to urban areas [km]:

none in region


Radius: 1 km

Number of landcover classes:

2

Dominant landcover type:

130: grassland

Fraction of dominant landcover type [%]:

69.0


Radius: 2 km

Number of landcover classes:

3

Dominant landcover type:

130: grassland

Fraction of dominant landcover type [%]:

89.0


Radius: 5 km

Number of landcover classes:

5

Dominant landcover type:

130: grassland

Fraction of dominant landcover type [%]:

83.0


Radius: 10 km

Number of landcover classes:

4

Dominant landcover type:

130: grassland

Fraction of dominant landcover type [%]:

87.0


Radius: 20 km

Number of landcover classes:

4

Dominant landcover type:

130: grassland

Fraction of dominant landcover type [%]:

71.0


Disturbances


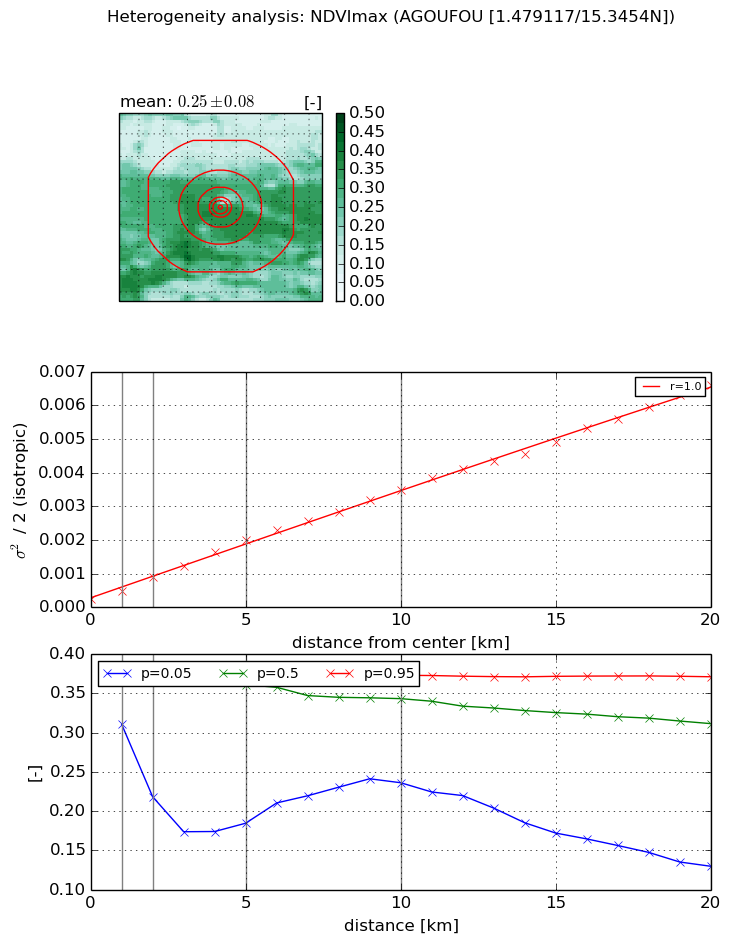
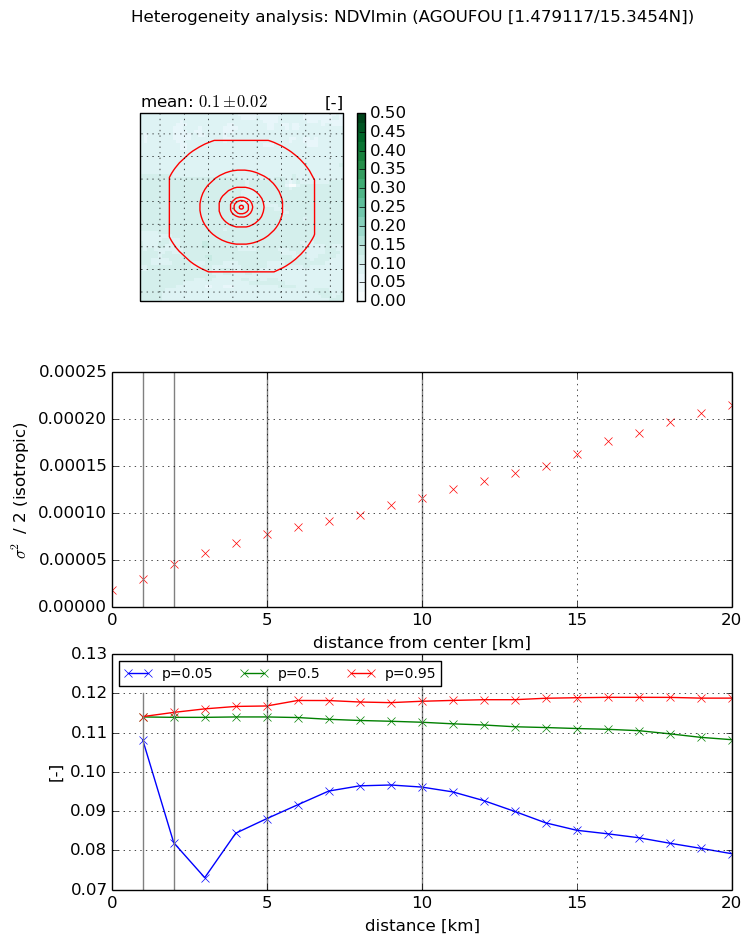
Heterogeneity analysis

The heterogeneity analysis provides information about the spatial and temporal heterogeneity of the site.

Topography


Roman et al. (2009) index


St

0.000328159861651

Rcv

0.457841285142

Rse

0.0

Rst

-3.26383707406e-06

Rsv

9141.42801837


Height range @ 1km [m]

9

Height range @ 2km [m]

21

Height range @ 5km [m]

37

Height range @ 10km [m]

-999

Height range @ 20km [m]

-999


Variance slope @ 1 km

53

Variance slope @ 2 km

47

Variance slope @ 5 km

28

Variance slope @ 10 km

-999

Variance slope @ 20 km

-999


NDVI (max. NDVI composite)


Roman et al. (2009) index


St

5.49220808212e-07

Rcv

-0.085051079767

Rse

0.0

Rst

0.412575315755

Rsv

5462283.44199


NDVI range @ 1km [-]

0.06

NDVI range @ 2km [-]

0.15

NDVI range @ 5km [-]

0.19

NDVI range @ 10km [-]

0.14

NDVI range @ 20km [-]

0.24


Variance slope @ 1 km

0.000230605195868

Variance slope @ 2 km

0.000321561139606

Variance slope @ 5 km

0.000358946030591

Variance slope @ 10 km

0.000330473419671

Variance slope @ 20 km

0.000313971605154


NDVI (min. NDVI composite)I


Roman et al. (2009) index


St

4.68163772762

Rcv

-0.267453471204

Rse

0.0

Rst

-0.275775492136

Rsv

0.0975724344916


NDVI range @ 1km [-]

0.01

NDVI range @ 2km [-]

0.03

NDVI range @ 5km [-]

0.03

NDVI range @ 10km [-]

0.02

NDVI range @ 20km [-]

0.04


NDVI slope @ 1 km

1.15997283383e-05

NDVI slope @ 2 km

1.37405352541e-05

NDVI slope @ 5 km

1.19589065646e-05

NDVI slope @ 10 km

9.44227377331e-06

NDVI slope @ 20 km

9.39295336756e-06


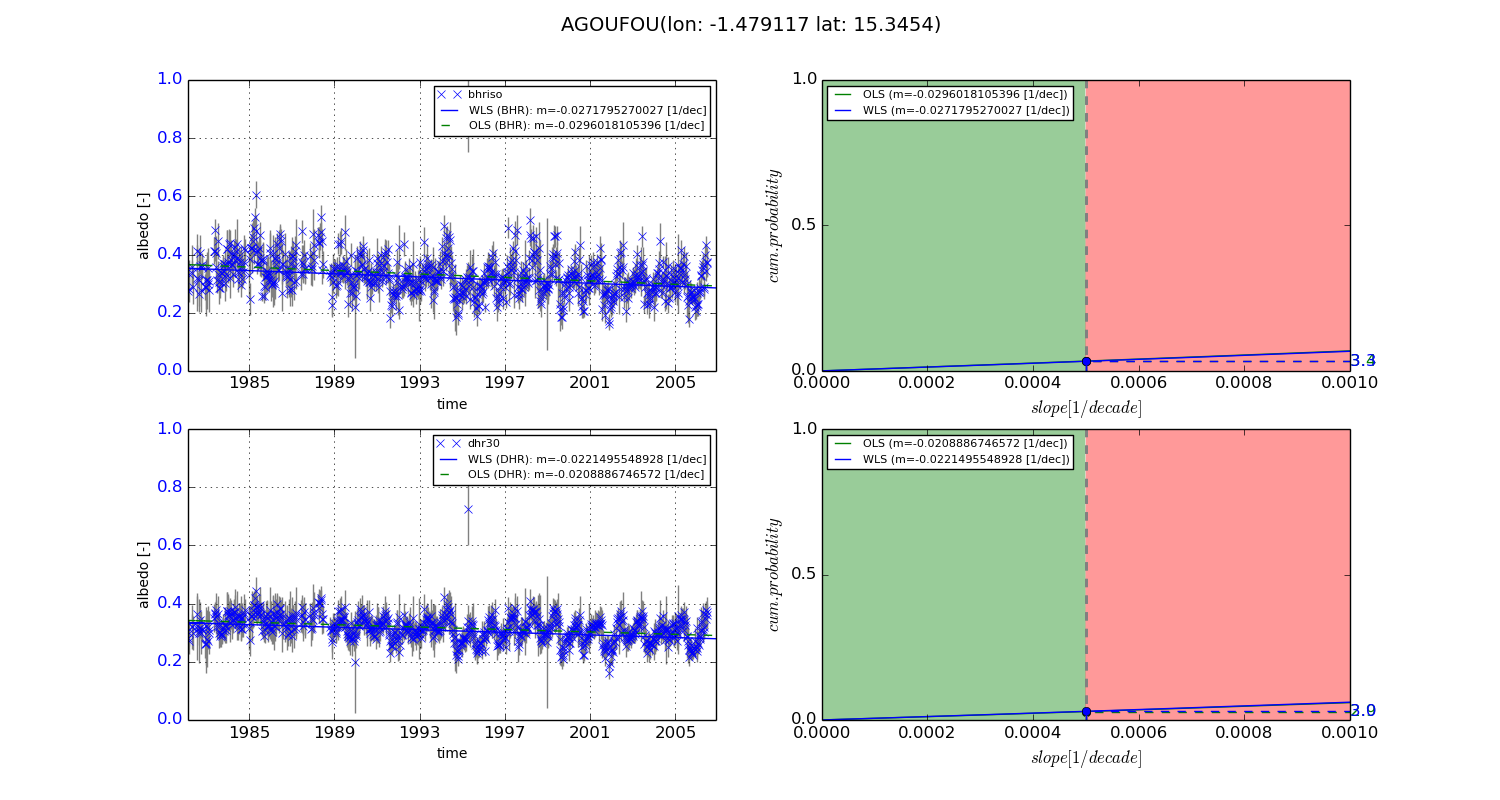
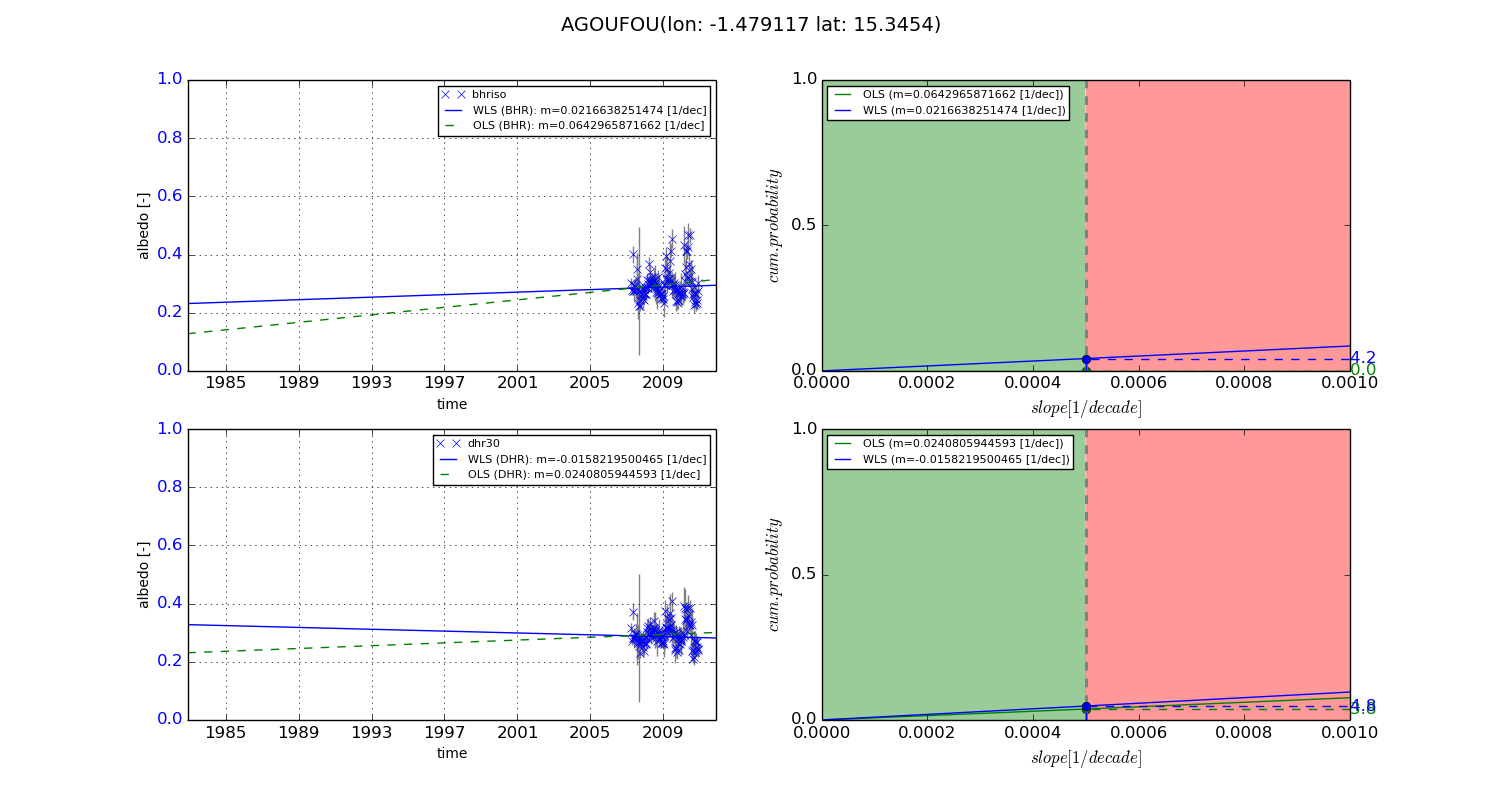
Temporal stability analysis

+000 deg (BHR)


BHR statistics

Temporal stability [1/decade]:


abs

rel


Weighted least square:

-0.0271795270027


Ordinary least square:

-0.0296018105396


Probabilities that GCOS criteria is met:

Weighted least square:

3.3 %

Ordinary least square:

3.4 %


DHR statistics

Temporal stability [1/decade]:


abs

rel


Weighted least square:

-0.0221495548928


Ordinary least square:

-0.0208886746572


Probabilities that GCOS criteria is met:

Weighted least square:

3.0 %

Ordinary least square:

2.9 %


+057/+063 deg (BHR)


BHR statistics

Temporal stability [1/decade]:


abs

rel


Weighted least square:

0.0216638251474


Ordinary least square:

0.0642965871662


Probabilities that GCOS criteria is met:

Weighted least square:

4.2 %

Ordinary least square:

0.0 %


DHR statistics

Temporal stability [1/decade]:


abs

rel


Weighted least square:

-0.0158219500465


Ordinary least square:

0.0240805944593


Probabilities that GCOS criteria is met:

Weighted least square:

4.8 %

Ordinary least square:

3.8 %


Temporal anomaly analyis

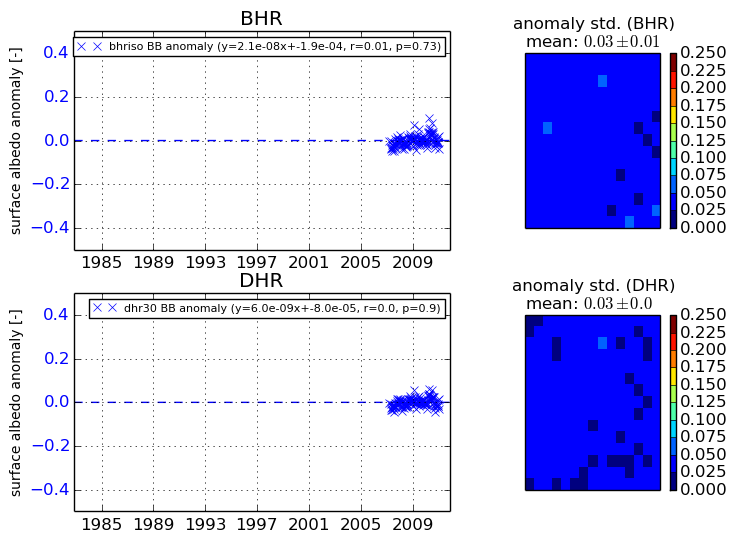
The variance of the temporal anomalies provides an additional measure about the stability of the signal AFTER removal of the mean seasonal cylce.
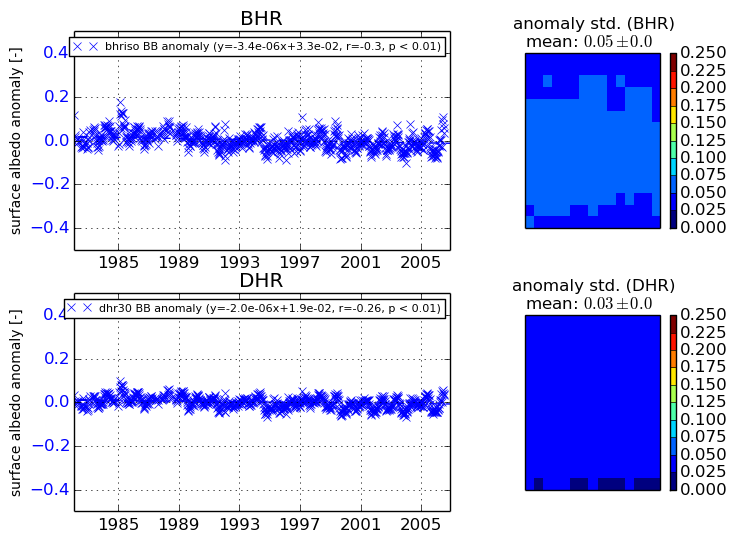
+000 deg


+057/+063 deg