AGRI_SCHOOL


Location

lon / lat [deg]: -56.1803 / -10.0808

Source network: AERONET


Geostationary surface albedo (GSA) data


“+000”


“+057/+063”


Landcover information (based on ESA CCI landcover data)


Landcover fractions @ 2km distance


Landcover fractions @ 20 km distance


Legend


Distance to open water bodies [km]:

9.35

Distance to urban areas [km]:

none in region


Radius: 1 km

Number of landcover classes:

5

Dominant landcover type:

10: cropland, rainfed

Fraction of dominant landcover type [%]:

44.0


Radius: 2 km

Number of landcover classes:

5

Dominant landcover type:

10: cropland, rainfed

Fraction of dominant landcover type [%]:

34.0


Radius: 5 km

Number of landcover classes:

5

Dominant landcover type:

10: cropland, rainfed

Fraction of dominant landcover type [%]:

31.0


Radius: 10 km

Number of landcover classes:

4

Dominant landcover type:

50: Tree cover, broadleaved, evergreen, closed to open (>15%)

Fraction of dominant landcover type [%]:

30.0


Radius: 20 km

Number of landcover classes:

4

Dominant landcover type:

50: Tree cover, broadleaved, evergreen, closed to open (>15%)

Fraction of dominant landcover type [%]:

43.0


Disturbances


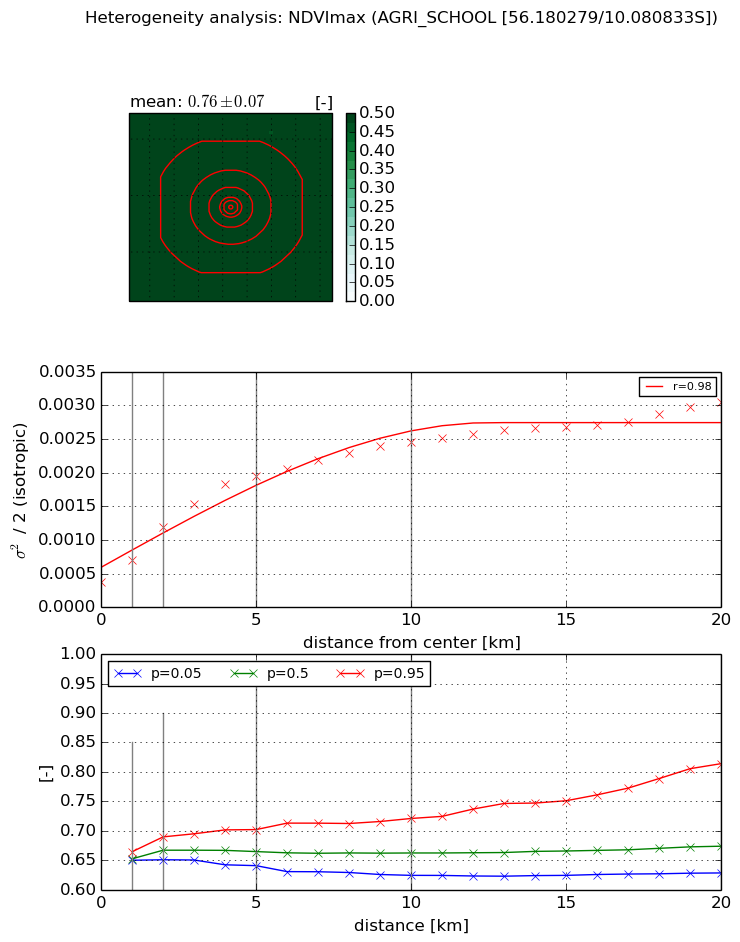
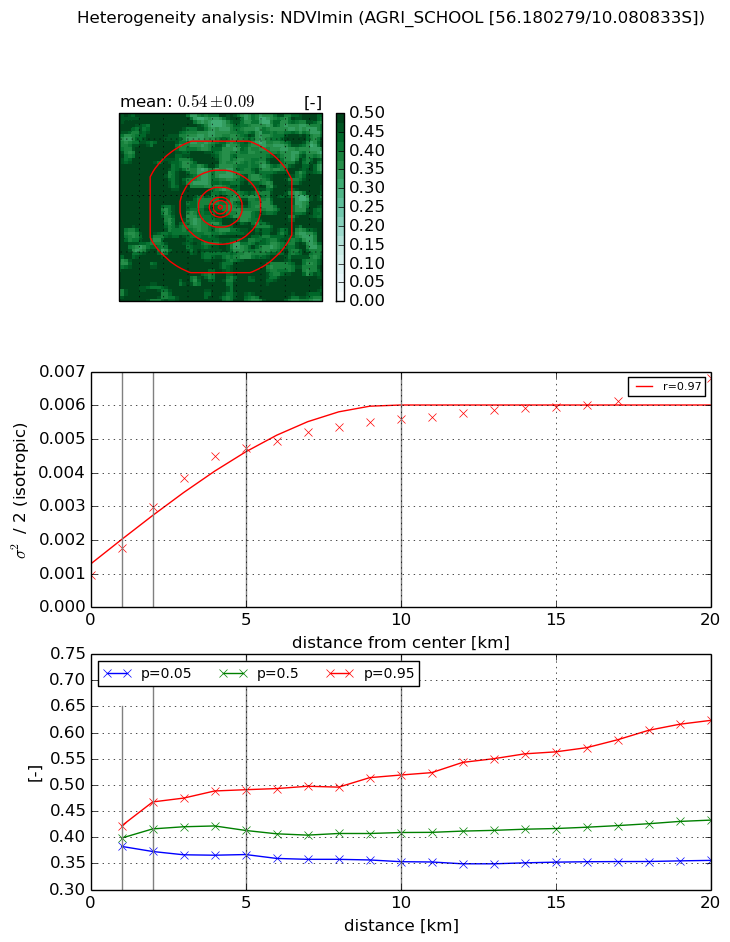
Heterogeneity analysis

The heterogeneity analysis provides information about the spatial and temporal heterogeneity of the site.

Topography


Roman et al. (2009) index


St

2.0491038919

Rcv

0.464062773572

Rse

0.0

Rst

-1.5516735891e-06

Rsv

-0.999990285093


Height range @ 1km [m]

8

Height range @ 2km [m]

17

Height range @ 5km [m]

37

Height range @ 10km [m]

-999

Height range @ 20km [m]

-999


Variance slope @ 1 km

4

Variance slope @ 2 km

9

Variance slope @ 5 km

25

Variance slope @ 10 km

-999

Variance slope @ 20 km

-999


NDVI (max. NDVI composite)


Roman et al. (2009) index


St

0.723518736567

Rcv

0.317838845665

Rse

0.0

Rst

-0.843394395966

Rsv

2.98516939921


NDVI range @ 1km [-]

0.01

NDVI range @ 2km [-]

0.04

NDVI range @ 5km [-]

0.06

NDVI range @ 10km [-]

0.1

NDVI range @ 20km [-]

0.19


Variance slope @ 1 km

0.000317621262306

Variance slope @ 2 km

0.000406262519271

Variance slope @ 5 km

0.000331785398161

Variance slope @ 10 km

0.000200273872594

Variance slope @ 20 km

0.000107272711482


NDVI (min. NDVI composite)I


Roman et al. (2009) index


St

8.33752781257

Rcv

0.0879842935248

Rse

0.0

Rst

0.0856746532027

Rsv

-0.186159942929


NDVI range @ 1km [-]

0.04

NDVI range @ 2km [-]

0.09

NDVI range @ 5km [-]

0.12

NDVI range @ 10km [-]

0.17

NDVI range @ 20km [-]

0.27


NDVI slope @ 1 km

0.0007985609104

NDVI slope @ 2 km

0.0010187256329

NDVI slope @ 5 km

0.000802704615339

NDVI slope @ 10 km

0.000440846114585

NDVI slope @ 20 km

0.000219101491537


Temporal stability analysis

+000 deg (BHR)


BHR statistics

Temporal stability [1/decade]:


abs

rel


Weighted least square:

-99999.0


Ordinary least square:

-99999.0


Probabilities that GCOS criteria is met:

Weighted least square:

-99999.0 %

Ordinary least square:

-99999.0 %


DHR statistics

Temporal stability [1/decade]:


abs

rel


Weighted least square:

-99999.0


Ordinary least square:

-99999.0


Probabilities that GCOS criteria is met:

Weighted least square:

-99999.0 %

Ordinary least square:

-99999.0 %


+057/+063 deg (BHR)


BHR statistics

Temporal stability [1/decade]:


abs

rel


Weighted least square:

None


Ordinary least square:

None


Probabilities that GCOS criteria is met:

Weighted least square:

None %

Ordinary least square:

None %


DHR statistics

Temporal stability [1/decade]:


abs

rel


Weighted least square:

None


Ordinary least square:

None


Probabilities that GCOS criteria is met:

Weighted least square:

None %

Ordinary least square:

None %


Temporal anomaly analyis

The variance of the temporal anomalies provides an additional measure about the stability of the signal AFTER removal of the mean seasonal cylce.

+000 deg


+057/+063 deg