AHMEDABAD


Location

lon / lat [deg]: 72.5167 / 23.0167

Source network: AERONET


Geostationary surface albedo (GSA) data


“+000”


“+057/+063”


Landcover information (based on ESA CCI landcover data)


Landcover fractions @ 2km distance


Landcover fractions @ 20 km distance


Legend


Distance to open water bodies [km]:

4.85

Distance to urban areas [km]:

0.21


Radius: 1 km

Number of landcover classes:

1

Dominant landcover type:

190: urban areas

Fraction of dominant landcover type [%]:

100.0


Radius: 2 km

Number of landcover classes:

2

Dominant landcover type:

190: urban areas

Fraction of dominant landcover type [%]:

97.0


Radius: 5 km

Number of landcover classes:

5

Dominant landcover type:

190: urban areas

Fraction of dominant landcover type [%]:

71.0


Radius: 10 km

Number of landcover classes:

6

Dominant landcover type:

190: urban areas

Fraction of dominant landcover type [%]:

45.0


Radius: 20 km

Number of landcover classes:

4

Dominant landcover type:

10: cropland, rainfed

Fraction of dominant landcover type [%]:

54.0


Disturbances


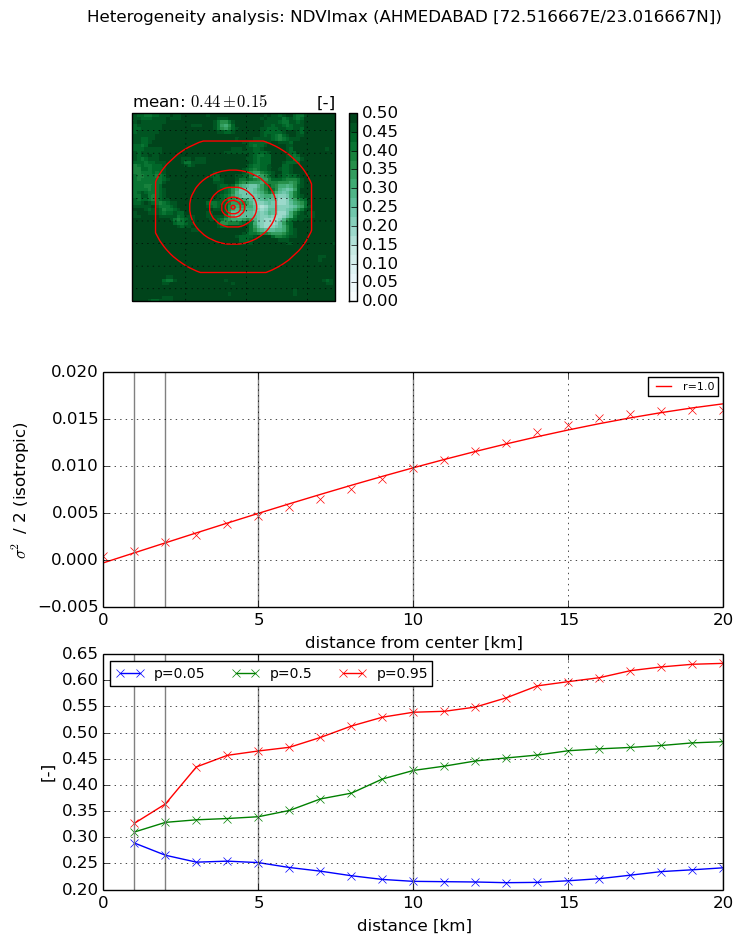
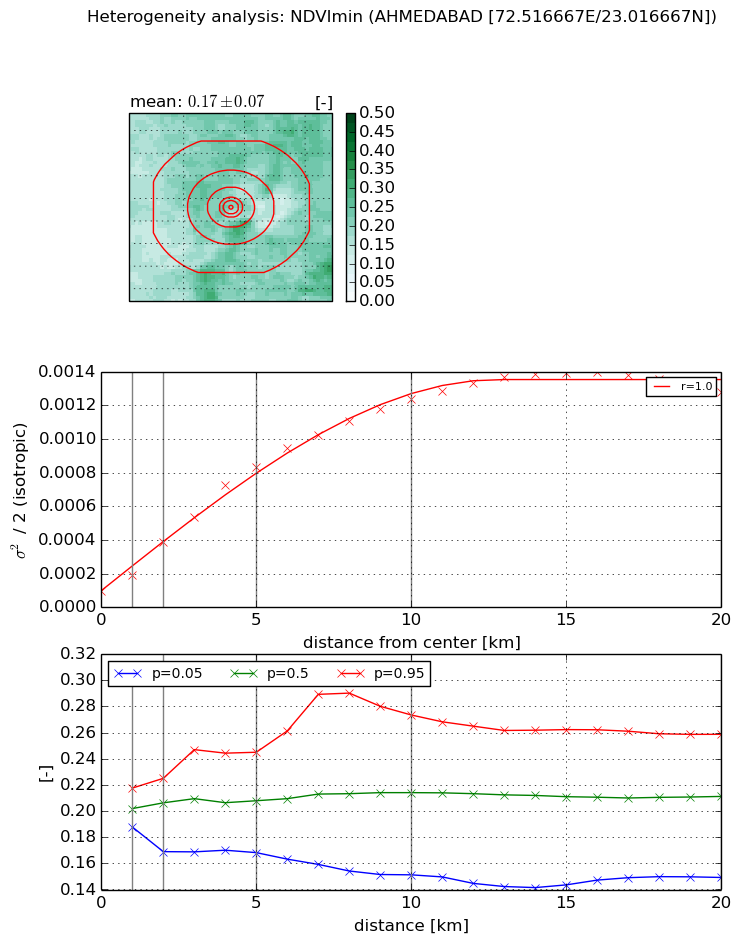
Heterogeneity analysis

The heterogeneity analysis provides information about the spatial and temporal heterogeneity of the site.

Topography


Roman et al. (2009) index


St

2.57216767757

Rcv

0.136318301886

Rse

0.0

Rst

-0.0300131431623

Rsv

-0.999999982784


Height range @ 1km [m]

16

Height range @ 2km [m]

16

Height range @ 5km [m]

17

Height range @ 10km [m]

-999

Height range @ 20km [m]

-999


Variance slope @ 1 km

7

Variance slope @ 2 km

4

Variance slope @ 5 km

4

Variance slope @ 10 km

-999

Variance slope @ 20 km

-999


NDVI (max. NDVI composite)


Roman et al. (2009) index


St

2.29137161534

Rcv

0.238449817273

Rse

0.0

Rst

-0.070810092305

Rsv

-0.999999566239


NDVI range @ 1km [-]

0.04

NDVI range @ 2km [-]

0.1

NDVI range @ 5km [-]

0.21

NDVI range @ 10km [-]

0.32

NDVI range @ 20km [-]

0.39


Variance slope @ 1 km

0.000463491075445

Variance slope @ 2 km

0.000712252394023

Variance slope @ 5 km

0.000872389027601

Variance slope @ 10 km

0.000940037453626

Variance slope @ 20 km

0.000863738165572


NDVI (min. NDVI composite)I


Roman et al. (2009) index


St

nan

Rcv

nan

Rse

nan

Rst

nan

Rsv

nan


NDVI range @ 1km [-]

0.03

NDVI range @ 2km [-]

0.06

NDVI range @ 5km [-]

0.08

NDVI range @ 10km [-]

0.12

NDVI range @ 20km [-]

0.11


NDVI slope @ 1 km

9.23381541607e-05

NDVI slope @ 2 km

0.000143092400668

NDVI slope @ 5 km

0.000155603301119

NDVI slope @ 10 km

0.000118216016897

NDVI slope @ 20 km

5.95649467205e-05


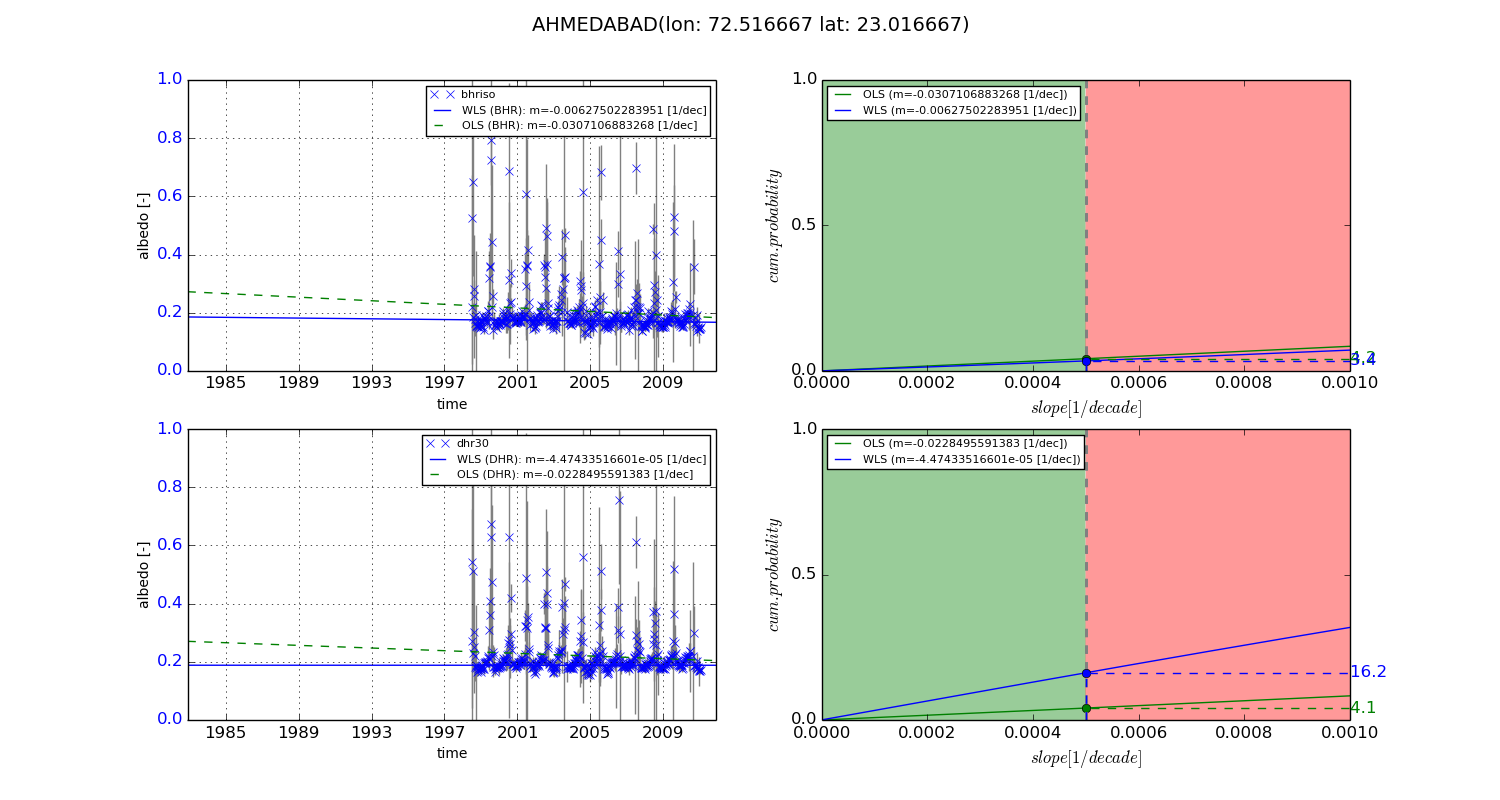
Temporal stability analysis

+000 deg (BHR)


BHR statistics

Temporal stability [1/decade]:


abs

rel


Weighted least square:

-99999.0


Ordinary least square:

-99999.0


Probabilities that GCOS criteria is met:

Weighted least square:

-99999.0 %

Ordinary least square:

-99999.0 %


DHR statistics

Temporal stability [1/decade]:


abs

rel


Weighted least square:

-99999.0


Ordinary least square:

-99999.0


Probabilities that GCOS criteria is met:

Weighted least square:

-99999.0 %

Ordinary least square:

-99999.0 %


+057/+063 deg (BHR)


BHR statistics

Temporal stability [1/decade]:


abs

rel


Weighted least square:

-0.00627502283951


Ordinary least square:

-0.0307106883268


Probabilities that GCOS criteria is met:

Weighted least square:

3.4 %

Ordinary least square:

4.2 %


DHR statistics

Temporal stability [1/decade]:


abs

rel


Weighted least square:

-4.47433516601e-05


Ordinary least square:

-0.0228495591383


Probabilities that GCOS criteria is met:

Weighted least square:

16.2 %

Ordinary least square:

4.1 %


Temporal anomaly analyis

The variance of the temporal anomalies provides an additional measure about the stability of the signal AFTER removal of the mean seasonal cylce.

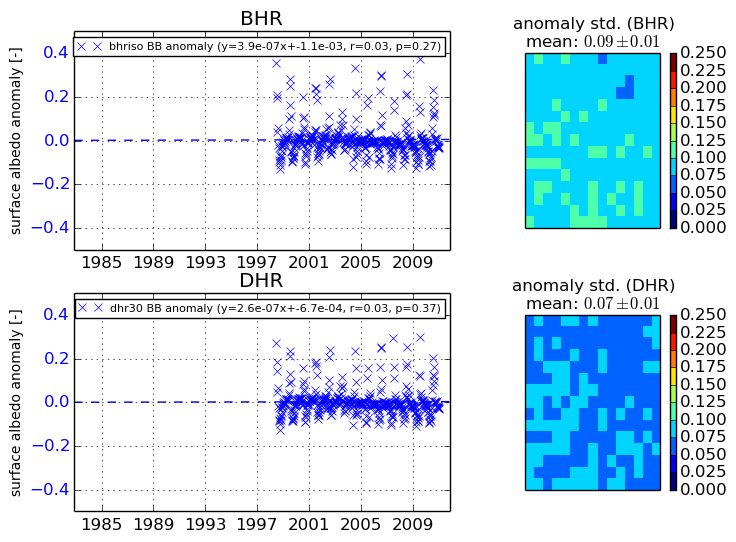
+000 deg


+057/+063 deg