AIRE_ADOUR


Location

lon / lat [deg]: 0.25 / 43.7

Source network: AERONET


Geostationary surface albedo (GSA) data


“+000”


“+057/+063”


Landcover information (based on ESA CCI landcover data)


Landcover fractions @ 2km distance


Landcover fractions @ 20 km distance


Legend


Distance to open water bodies [km]:

6.27

Distance to urban areas [km]:

6.86


Radius: 1 km

Number of landcover classes:

1

Dominant landcover type:

10: cropland, rainfed

Fraction of dominant landcover type [%]:

100.0


Radius: 2 km

Number of landcover classes:

2

Dominant landcover type:

10: cropland, rainfed

Fraction of dominant landcover type [%]:

97.0


Radius: 5 km

Number of landcover classes:

2

Dominant landcover type:

10: cropland, rainfed

Fraction of dominant landcover type [%]:

98.0


Radius: 10 km

Number of landcover classes:

2

Dominant landcover type:

10: cropland, rainfed

Fraction of dominant landcover type [%]:

96.0


Radius: 20 km

Number of landcover classes:

4

Dominant landcover type:

10: cropland, rainfed

Fraction of dominant landcover type [%]:

91.0


Disturbances


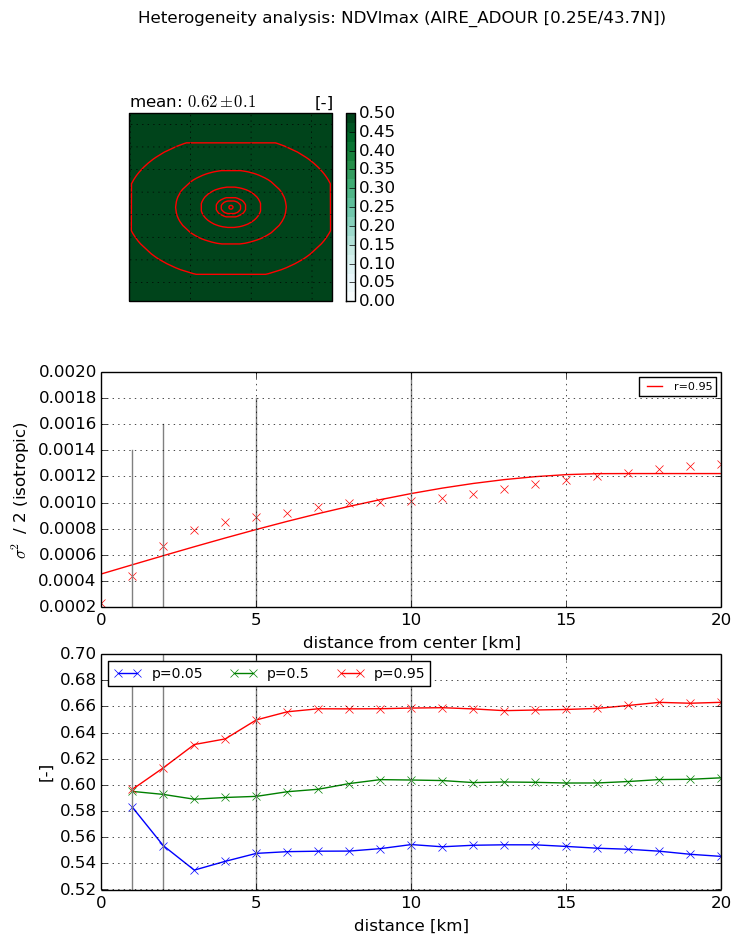
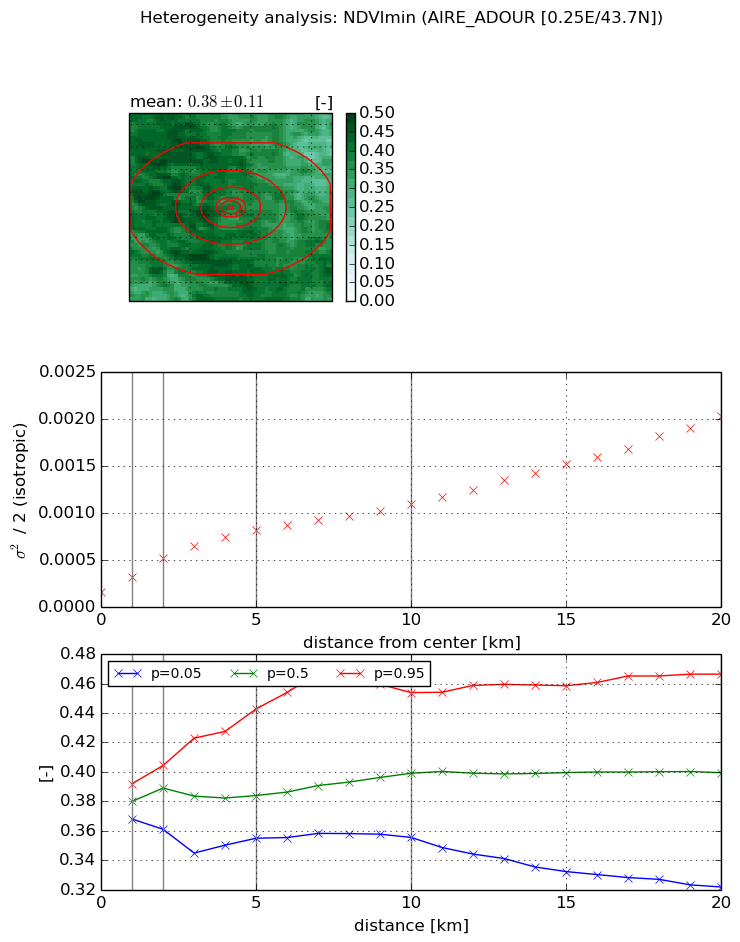
Heterogeneity analysis

The heterogeneity analysis provides information about the spatial and temporal heterogeneity of the site.

Topography


Roman et al. (2009) index


St

0.000850420123793

Rcv

0.289523497495

Rse

0.0

Rst

-0.248261505277

Rsv

3527.13038284


Height range @ 1km [m]

45

Height range @ 2km [m]

48

Height range @ 5km [m]

77

Height range @ 10km [m]

-999

Height range @ 20km [m]

-999


Variance slope @ 1 km

265

Variance slope @ 2 km

197

Variance slope @ 5 km

106

Variance slope @ 10 km

-999

Variance slope @ 20 km

-999


NDVI (max. NDVI composite)


Roman et al. (2009) index


St

46.7661892234

Rcv

0.0390615134239

Rse

0.0

Rst

-0.000730002877873

Rsv

-0.0243573923396


NDVI range @ 1km [-]

0.01

NDVI range @ 2km [-]

0.06

NDVI range @ 5km [-]

0.1

NDVI range @ 10km [-]

0.1

NDVI range @ 20km [-]

0.12


Variance slope @ 1 km

0.00021206837187

Variance slope @ 2 km

0.000217417278564

Variance slope @ 5 km

0.000133403099718

Variance slope @ 10 km

6.86665930968e-05

Variance slope @ 20 km

4.02921000614e-05


NDVI (min. NDVI composite)I


Roman et al. (2009) index


St

3.5061441484

Rcv

0.148767011926

Rse

0.0

Rst

-0.0900002499441

Rsv

0.616873542679


NDVI range @ 1km [-]

0.02

NDVI range @ 2km [-]

0.04

NDVI range @ 5km [-]

0.09

NDVI range @ 10km [-]

0.1

NDVI range @ 20km [-]

0.14


NDVI slope @ 1 km

0.000163637694011

NDVI slope @ 2 km

0.000178773144277

NDVI slope @ 5 km

0.000134816704692

NDVI slope @ 10 km

8.6393028357e-05

NDVI slope @ 20 km

8.2212907006e-05


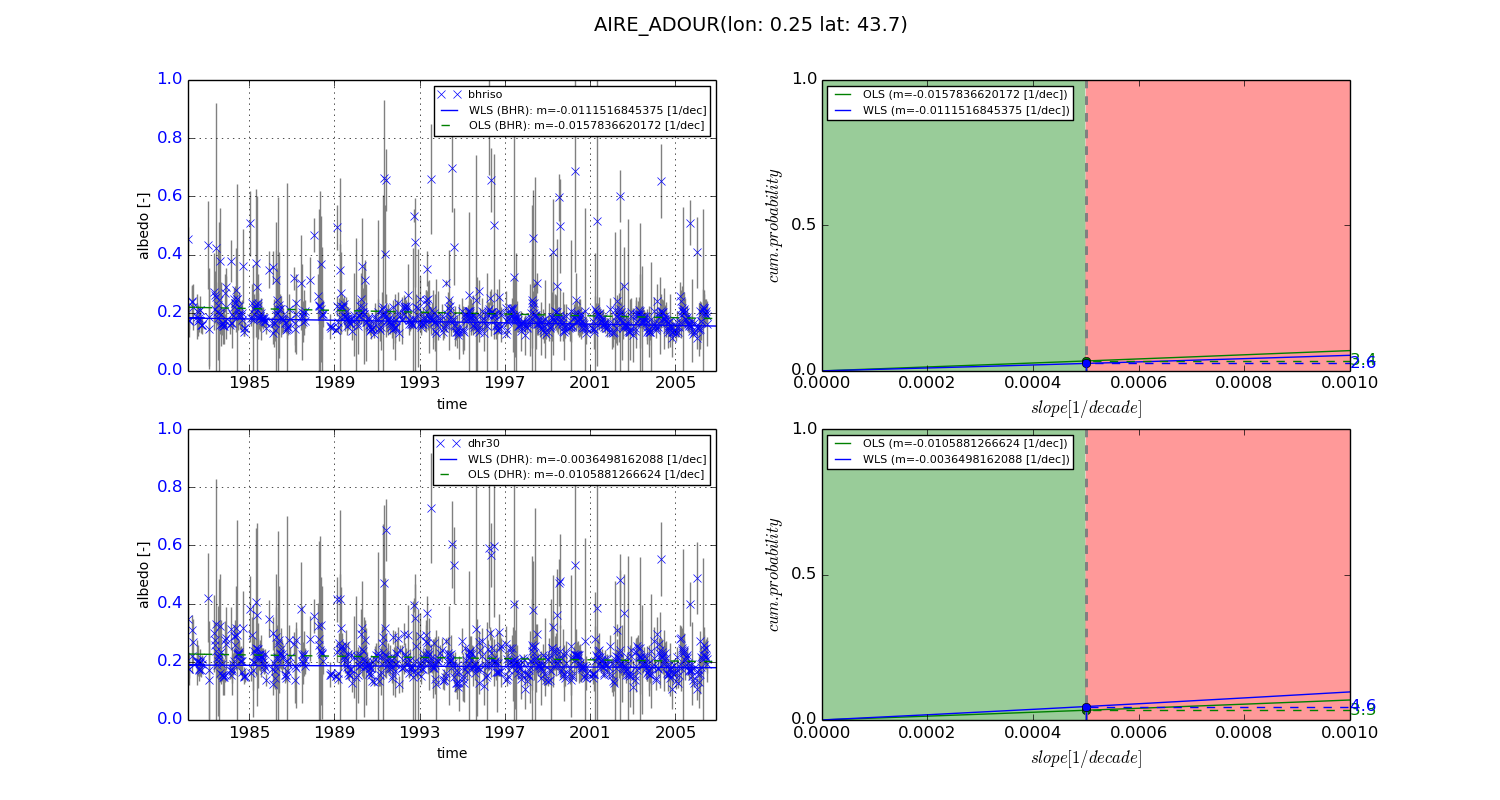
Temporal stability analysis

+000 deg (BHR)


BHR statistics

Temporal stability [1/decade]:


abs

rel


Weighted least square:

-0.0111516845375


Ordinary least square:

-0.0157836620172


Probabilities that GCOS criteria is met:

Weighted least square:

2.6 %

Ordinary least square:

3.4 %


DHR statistics

Temporal stability [1/decade]:


abs

rel


Weighted least square:

-0.0036498162088


Ordinary least square:

-0.0105881266624


Probabilities that GCOS criteria is met:

Weighted least square:

4.6 %

Ordinary least square:

3.3 %


+057/+063 deg (BHR)


BHR statistics

Temporal stability [1/decade]:


abs

rel


Weighted least square:

-99999.0


Ordinary least square:

-99999.0


Probabilities that GCOS criteria is met:

Weighted least square:

-99999.0 %

Ordinary least square:

-99999.0 %


DHR statistics

Temporal stability [1/decade]:


abs

rel


Weighted least square:

-99999.0


Ordinary least square:

-99999.0


Probabilities that GCOS criteria is met:

Weighted least square:

-99999.0 %

Ordinary least square:

-99999.0 %


Temporal anomaly analyis

The variance of the temporal anomalies provides an additional measure about the stability of the signal AFTER removal of the mean seasonal cylce.
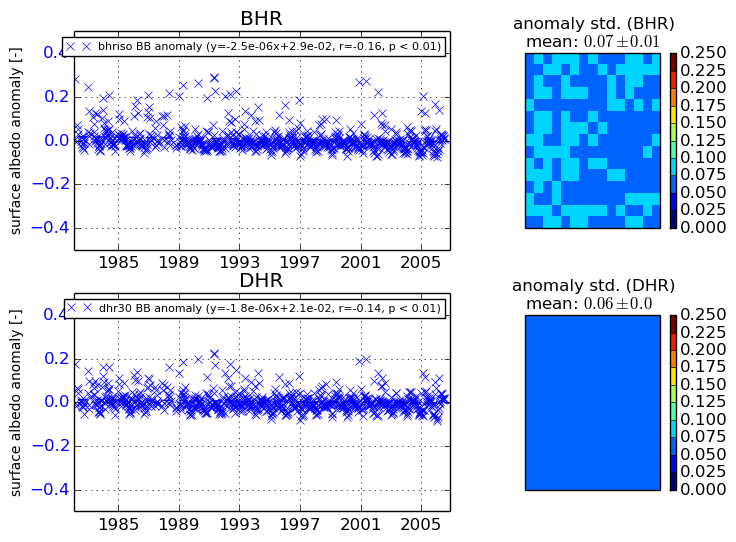
+000 deg


+057/+063 deg