ALBANY_OREGON


Location

lon / lat [deg]: -123.0667 / 44.5833

Source network: AERONET


Geostationary surface albedo (GSA) data


“+000”


“+057/+063”


Landcover information (based on ESA CCI landcover data)


Landcover fractions @ 2km distance


Landcover fractions @ 20 km distance


Legend


Distance to open water bodies [km]:

5.54

Distance to urban areas [km]:

1.59


Radius: 1 km

Number of landcover classes:

2

Dominant landcover type:

130: grassland

Fraction of dominant landcover type [%]:

77.0


Radius: 2 km

Number of landcover classes:

4

Dominant landcover type:

130: grassland

Fraction of dominant landcover type [%]:

71.0


Radius: 5 km

Number of landcover classes:

5

Dominant landcover type:

130: grassland

Fraction of dominant landcover type [%]:

56.0


Radius: 10 km

Number of landcover classes:

5

Dominant landcover type:

130: grassland

Fraction of dominant landcover type [%]:

58.0


Radius: 20 km

Number of landcover classes:

5

Dominant landcover type:

130: grassland

Fraction of dominant landcover type [%]:

66.0


Disturbances


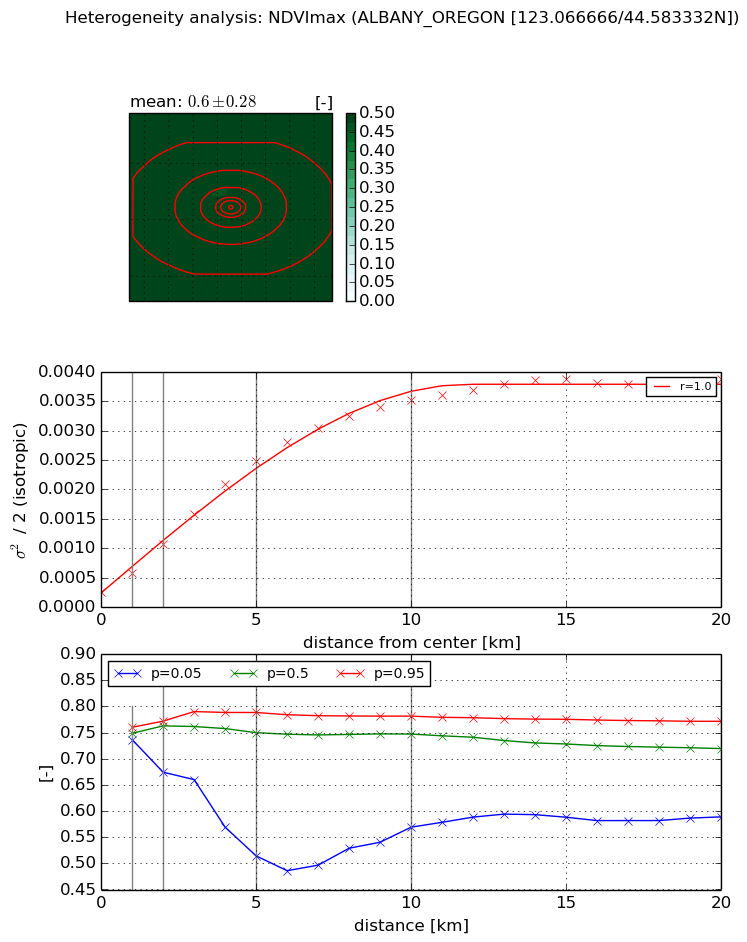
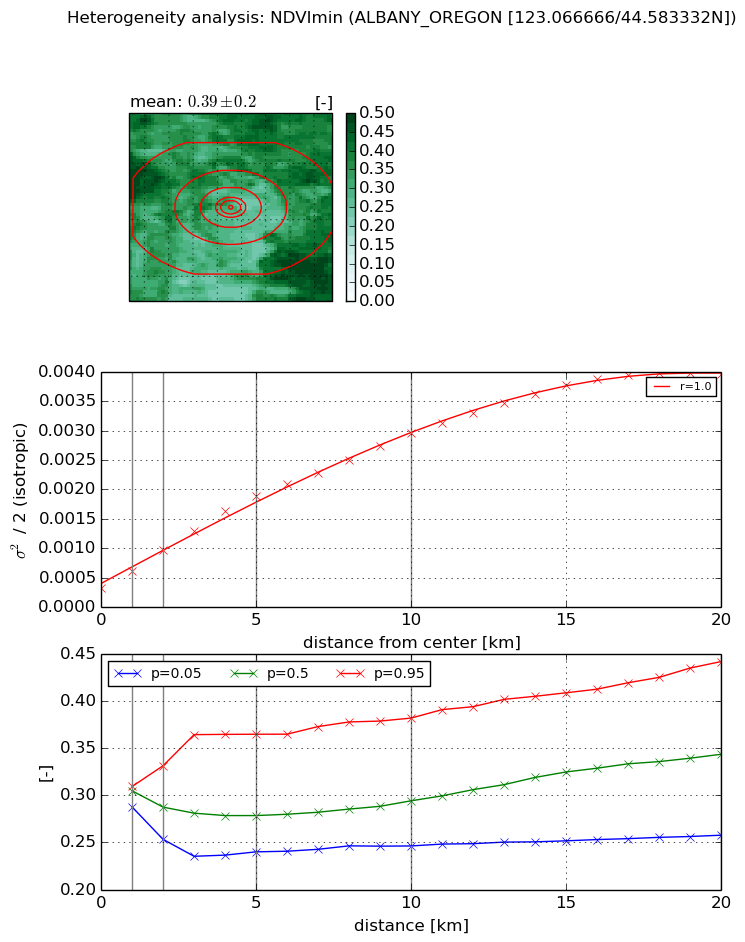
Heterogeneity analysis

The heterogeneity analysis provides information about the spatial and temporal heterogeneity of the site.

Topography


Roman et al. (2009) index


St

0.450137163702

Rcv

0.49974678021

Rse

0.0

Rst

1.96152666049e-07

Rsv

6.16488825465


Height range @ 1km [m]

4

Height range @ 2km [m]

10

Height range @ 5km [m]

16

Height range @ 10km [m]

-999

Height range @ 20km [m]

-999


Variance slope @ 1 km

2

Variance slope @ 2 km

2

Variance slope @ 5 km

5

Variance slope @ 10 km

-999

Variance slope @ 20 km

-999


NDVI (max. NDVI composite)


Roman et al. (2009) index


St

1.86613132172

Rcv

0.827470096724

Rse

0.0

Rst

-0.101629965449

Rsv

0.67850384281


NDVI range @ 1km [-]

0.02

NDVI range @ 2km [-]

0.1

NDVI range @ 5km [-]

0.27

NDVI range @ 10km [-]

0.21

NDVI range @ 20km [-]

0.18


Variance slope @ 1 km

0.000319069976686

Variance slope @ 2 km

0.000411285493408

Variance slope @ 5 km

0.000462105076899

Variance slope @ 10 km

0.000344027776289

Variance slope @ 20 km

0.000165973965517


NDVI (min. NDVI composite)I


Roman et al. (2009) index


St

nan

Rcv

nan

Rse

nan

Rst

nan

Rsv

nan


NDVI range @ 1km [-]

0.02

NDVI range @ 2km [-]

0.08

NDVI range @ 5km [-]

0.12

NDVI range @ 10km [-]

0.14

NDVI range @ 20km [-]

0.18


NDVI slope @ 1 km

0.000286547503696

NDVI slope @ 2 km

0.000325400545411

NDVI slope @ 5 km

0.000320795596449

NDVI slope @ 10 km

0.0002611267025

NDVI slope @ 20 km

0.000187178328251


Temporal stability analysis

+000 deg (BHR)


BHR statistics

Temporal stability [1/decade]:


abs

rel


Weighted least square:

None


Ordinary least square:

None


Probabilities that GCOS criteria is met:

Weighted least square:

None %

Ordinary least square:

None %


DHR statistics

Temporal stability [1/decade]:


abs

rel


Weighted least square:

None


Ordinary least square:

None


Probabilities that GCOS criteria is met:

Weighted least square:

None %

Ordinary least square:

None %


+057/+063 deg (BHR)


BHR statistics

Temporal stability [1/decade]:


abs

rel


Weighted least square:

None


Ordinary least square:

None


Probabilities that GCOS criteria is met:

Weighted least square:

None %

Ordinary least square:

None %


DHR statistics

Temporal stability [1/decade]:


abs

rel


Weighted least square:

None


Ordinary least square:

None


Probabilities that GCOS criteria is met:

Weighted least square:

None %

Ordinary least square:

None %


Temporal anomaly analyis

The variance of the temporal anomalies provides an additional measure about the stability of the signal AFTER removal of the mean seasonal cylce.

+000 deg


+057/+063 deg