ALBUQUERQUE


Location

lon / lat [deg]: -106.5358 / 35.0517

Source network: AERONET


Geostationary surface albedo (GSA) data


“+000”


“+057/+063”


Landcover information (based on ESA CCI landcover data)


Landcover fractions @ 2km distance


Landcover fractions @ 20 km distance


Legend


Distance to open water bodies [km]:

11.31

Distance to urban areas [km]:

0.11


Radius: 1 km

Number of landcover classes:

3

Dominant landcover type:

190: urban areas

Fraction of dominant landcover type [%]:

69.0


Radius: 2 km

Number of landcover classes:

3

Dominant landcover type:

190: urban areas

Fraction of dominant landcover type [%]:

68.0


Radius: 5 km

Number of landcover classes:

3

Dominant landcover type:

190: urban areas

Fraction of dominant landcover type [%]:

62.0


Radius: 10 km

Number of landcover classes:

4

Dominant landcover type:

190: urban areas

Fraction of dominant landcover type [%]:

48.0


Radius: 20 km

Number of landcover classes:

5

Dominant landcover type:

190: urban areas

Fraction of dominant landcover type [%]:

34.0


Disturbances


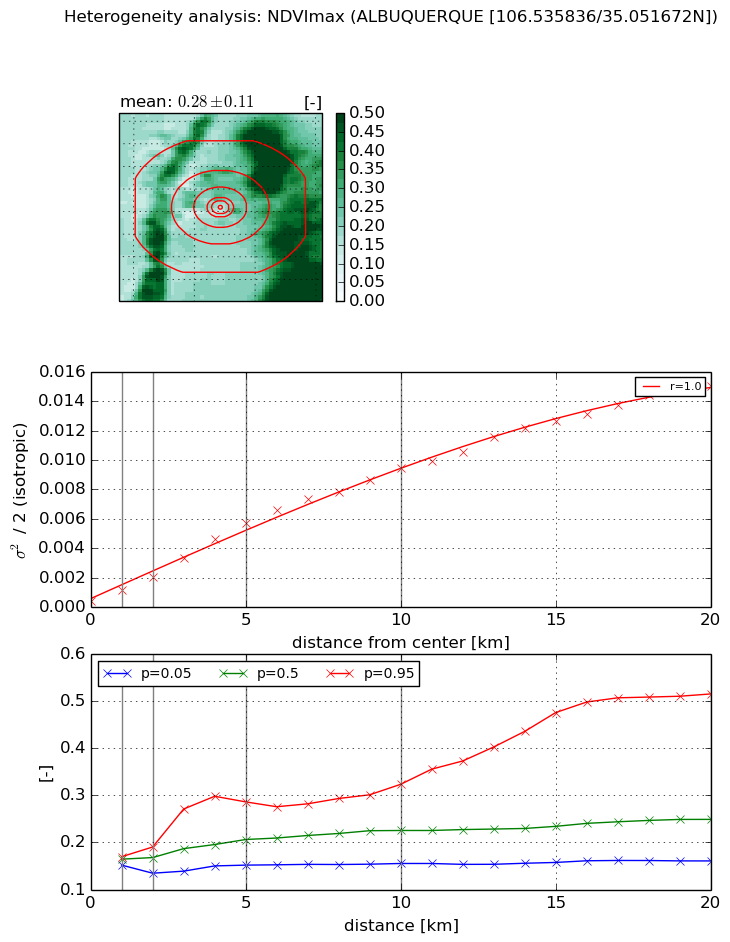
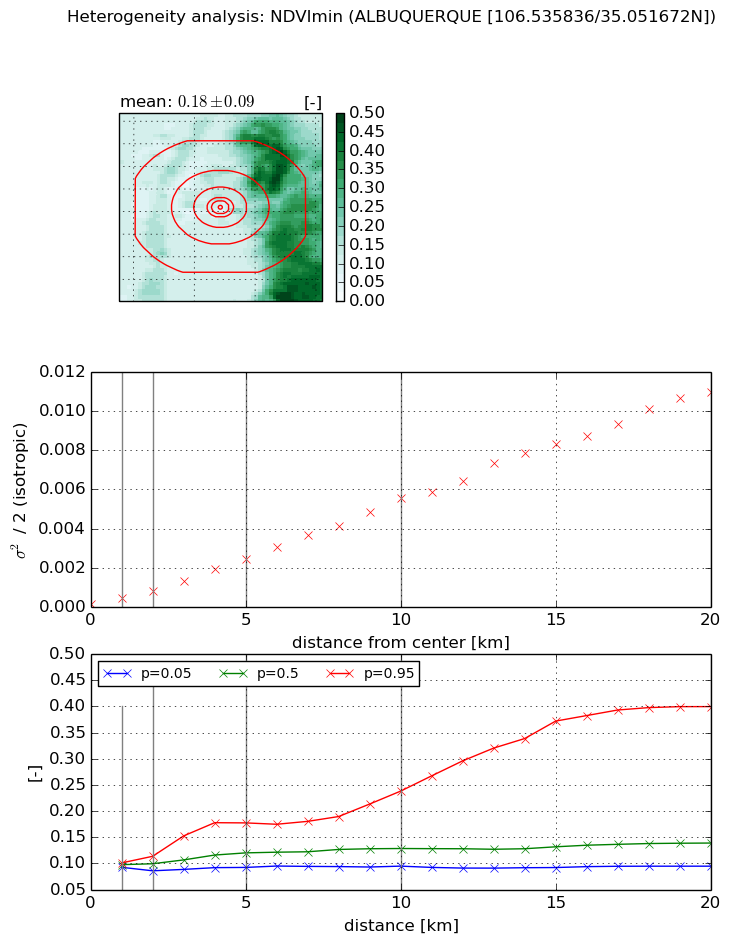
Heterogeneity analysis

The heterogeneity analysis provides information about the spatial and temporal heterogeneity of the site.

Topography


Roman et al. (2009) index


St

1.49363169183

Rcv

1.31103346931

Rse

0.0

Rst

2.3590419975e-07

Rsv

0.697493575247


Height range @ 1km [m]

20

Height range @ 2km [m]

40

Height range @ 5km [m]

155

Height range @ 10km [m]

-999

Height range @ 20km [m]

-999


Variance slope @ 1 km

624

Variance slope @ 2 km

700

Variance slope @ 5 km

789

Variance slope @ 10 km

-999

Variance slope @ 20 km

-999


NDVI (max. NDVI composite)


Roman et al. (2009) index


St

1.70225403232e-07

Rcv

-0.0714643724292

Rse

0.0

Rst

0.29372110716

Rsv

17623691.1816


NDVI range @ 1km [-]

0.02

NDVI range @ 2km [-]

0.06

NDVI range @ 5km [-]

0.13

NDVI range @ 10km [-]

0.17

NDVI range @ 20km [-]

0.35


Variance slope @ 1 km

0.000742844605765

Variance slope @ 2 km

0.000803657824102

Variance slope @ 5 km

0.00108105689213

Variance slope @ 10 km

0.000929552842944

Variance slope @ 20 km

0.000737242895139


NDVI (min. NDVI composite)I


Roman et al. (2009) index


St

1.99073178271e-07

Rcv

-0.0222815577857

Rse

0.0

Rst

0.242115727437

Rsv

15069834.9894


NDVI range @ 1km [-]

0.01

NDVI range @ 2km [-]

0.03

NDVI range @ 5km [-]

0.09

NDVI range @ 10km [-]

0.14

NDVI range @ 20km [-]

0.31


NDVI slope @ 1 km

0.000292745440906

NDVI slope @ 2 km

0.000319104976966

NDVI slope @ 5 km

0.000467988586262

NDVI slope @ 10 km

0.000547472044897

NDVI slope @ 20 km

0.000565476910714


Temporal stability analysis

+000 deg (BHR)


BHR statistics

Temporal stability [1/decade]:


abs

rel


Weighted least square:

None


Ordinary least square:

None


Probabilities that GCOS criteria is met:

Weighted least square:

None %

Ordinary least square:

None %


DHR statistics

Temporal stability [1/decade]:


abs

rel


Weighted least square:

None


Ordinary least square:

None


Probabilities that GCOS criteria is met:

Weighted least square:

None %

Ordinary least square:

None %


+057/+063 deg (BHR)


BHR statistics

Temporal stability [1/decade]:


abs

rel


Weighted least square:

None


Ordinary least square:

None


Probabilities that GCOS criteria is met:

Weighted least square:

None %

Ordinary least square:

None %


DHR statistics

Temporal stability [1/decade]:


abs

rel


Weighted least square:

None


Ordinary least square:

None


Probabilities that GCOS criteria is met:

Weighted least square:

None %

Ordinary least square:

None %


Temporal anomaly analyis

The variance of the temporal anomalies provides an additional measure about the stability of the signal AFTER removal of the mean seasonal cylce.

+000 deg


+057/+063 deg