ALIANCA


Location

lon / lat [deg]: -47.5333 / -14.7333

Source network: AERONET


Geostationary surface albedo (GSA) data


“+000”


“+057/+063”


Landcover information (based on ESA CCI landcover data)


Landcover fractions @ 2km distance


Landcover fractions @ 20 km distance


Legend


Distance to open water bodies [km]:

19.79

Distance to urban areas [km]:

1.73


Radius: 1 km

Number of landcover classes:

4

Dominant landcover type:

120: Shrubland

Fraction of dominant landcover type [%]:

62.0


Radius: 2 km

Number of landcover classes:

5

Dominant landcover type:

10: cropland, rainfed

Fraction of dominant landcover type [%]:

55.0


Radius: 5 km

Number of landcover classes:

5

Dominant landcover type:

120: Shrubland

Fraction of dominant landcover type [%]:

41.0


Radius: 10 km

Number of landcover classes:

8

Dominant landcover type:

10: cropland, rainfed

Fraction of dominant landcover type [%]:

42.0


Radius: 20 km

Number of landcover classes:

6

Dominant landcover type:

10: cropland, rainfed

Fraction of dominant landcover type [%]:

48.0


Disturbances


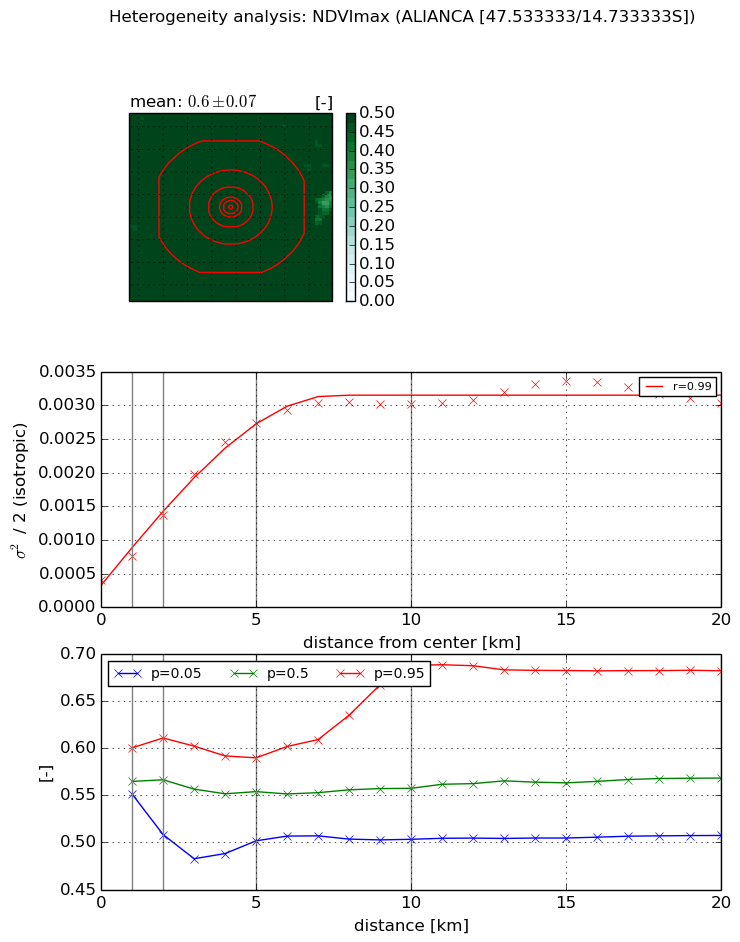
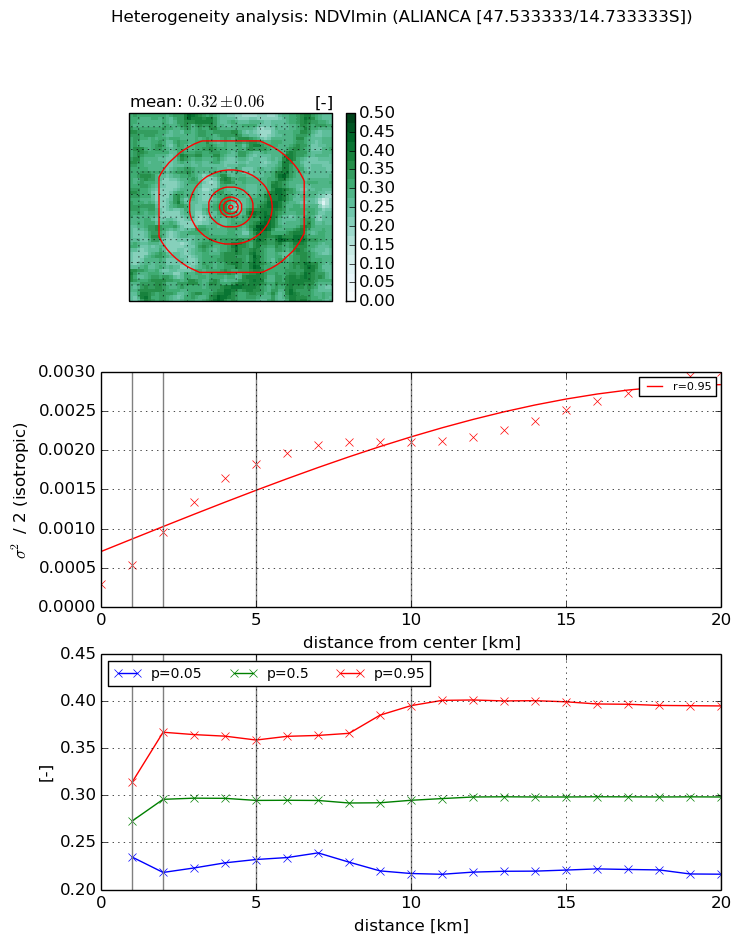
Heterogeneity analysis

The heterogeneity analysis provides information about the spatial and temporal heterogeneity of the site.

Topography


Roman et al. (2009) index


St

5.95883051732

Rcv

0.275140549498

Rse

0.0

Rst

-0.0426321640992

Rsv

-0.185681779911


Height range @ 1km [m]

68

Height range @ 2km [m]

98

Height range @ 5km [m]

146

Height range @ 10km [m]

-999

Height range @ 20km [m]

-999


Variance slope @ 1 km

1145

Variance slope @ 2 km

906

Variance slope @ 5 km

658

Variance slope @ 10 km

-999

Variance slope @ 20 km

-999


NDVI (max. NDVI composite)


Roman et al. (2009) index


St

9.40489493803

Rcv

-0.16917768149

Rse

0.0

Rst

0.000796938173869

Rsv

-0.149008209997


NDVI range @ 1km [-]

0.05

NDVI range @ 2km [-]

0.1

NDVI range @ 5km [-]

0.09

NDVI range @ 10km [-]

0.18

NDVI range @ 20km [-]

0.18


Variance slope @ 1 km

0.000361886495638

Variance slope @ 2 km

0.000485854970965

Variance slope @ 5 km

0.000494376699752

Variance slope @ 10 km

0.000270541853027

Variance slope @ 20 km

0.000105885714147


NDVI (min. NDVI composite)I


Roman et al. (2009) index


St

3.50079174223

Rcv

-0.270361018045

Rse

0.0

Rst

0.219052762513

Rsv

-0.36753522438


NDVI range @ 1km [-]

0.08

NDVI range @ 2km [-]

0.15

NDVI range @ 5km [-]

0.13

NDVI range @ 10km [-]

0.18

NDVI range @ 20km [-]

0.18


NDVI slope @ 1 km

0.000252782171239

NDVI slope @ 2 km

0.000331859157276

NDVI slope @ 5 km

0.000324300940574

NDVI slope @ 10 km

0.000186732364016

NDVI slope @ 20 km

0.000110911716647


Temporal stability analysis

+000 deg (BHR)


BHR statistics

Temporal stability [1/decade]:


abs

rel


Weighted least square:

-99999.0


Ordinary least square:

-99999.0


Probabilities that GCOS criteria is met:

Weighted least square:

-99999.0 %

Ordinary least square:

-99999.0 %


DHR statistics

Temporal stability [1/decade]:


abs

rel


Weighted least square:

-99999.0


Ordinary least square:

-99999.0


Probabilities that GCOS criteria is met:

Weighted least square:

-99999.0 %

Ordinary least square:

-99999.0 %


+057/+063 deg (BHR)


BHR statistics

Temporal stability [1/decade]:


abs

rel


Weighted least square:

None


Ordinary least square:

None


Probabilities that GCOS criteria is met:

Weighted least square:

None %

Ordinary least square:

None %


DHR statistics

Temporal stability [1/decade]:


abs

rel


Weighted least square:

None


Ordinary least square:

None


Probabilities that GCOS criteria is met:

Weighted least square:

None %

Ordinary least square:

None %


Temporal anomaly analyis

The variance of the temporal anomalies provides an additional measure about the stability of the signal AFTER removal of the mean seasonal cylce.

+000 deg


+057/+063 deg