AMES


Location

lon / lat [deg]: -93.7748 / 42.0214

Source network: AERONET


Geostationary surface albedo (GSA) data


“+000”


“+057/+063”


Landcover information (based on ESA CCI landcover data)


Landcover fractions @ 2km distance


Landcover fractions @ 20 km distance


Legend


Distance to open water bodies [km]:

10.08

Distance to urban areas [km]:

7.01


Radius: 1 km

Number of landcover classes:

1

Dominant landcover type:

10: cropland, rainfed

Fraction of dominant landcover type [%]:

100.0


Radius: 2 km

Number of landcover classes:

1

Dominant landcover type:

10: cropland, rainfed

Fraction of dominant landcover type [%]:

100.0


Radius: 5 km

Number of landcover classes:

3

Dominant landcover type:

10: cropland, rainfed

Fraction of dominant landcover type [%]:

97.0


Radius: 10 km

Number of landcover classes:

3

Dominant landcover type:

10: cropland, rainfed

Fraction of dominant landcover type [%]:

89.0


Radius: 20 km

Number of landcover classes:

5

Dominant landcover type:

10: cropland, rainfed

Fraction of dominant landcover type [%]:

83.0


Disturbances


Heterogeneity analysis

The heterogeneity analysis provides information about the spatial and temporal heterogeneity of the site.

Topography


Roman et al. (2009) index


St

1.15524736732

Rcv

0.579262456273

Rse

0.0

Rst

0.103926593954

Rsv

1.91365737839


Height range @ 1km [m]

6

Height range @ 2km [m]

10

Height range @ 5km [m]

23

Height range @ 10km [m]

-999

Height range @ 20km [m]

-999


Variance slope @ 1 km

11

Variance slope @ 2 km

14

Variance slope @ 5 km

14

Variance slope @ 10 km

-999

Variance slope @ 20 km

-999


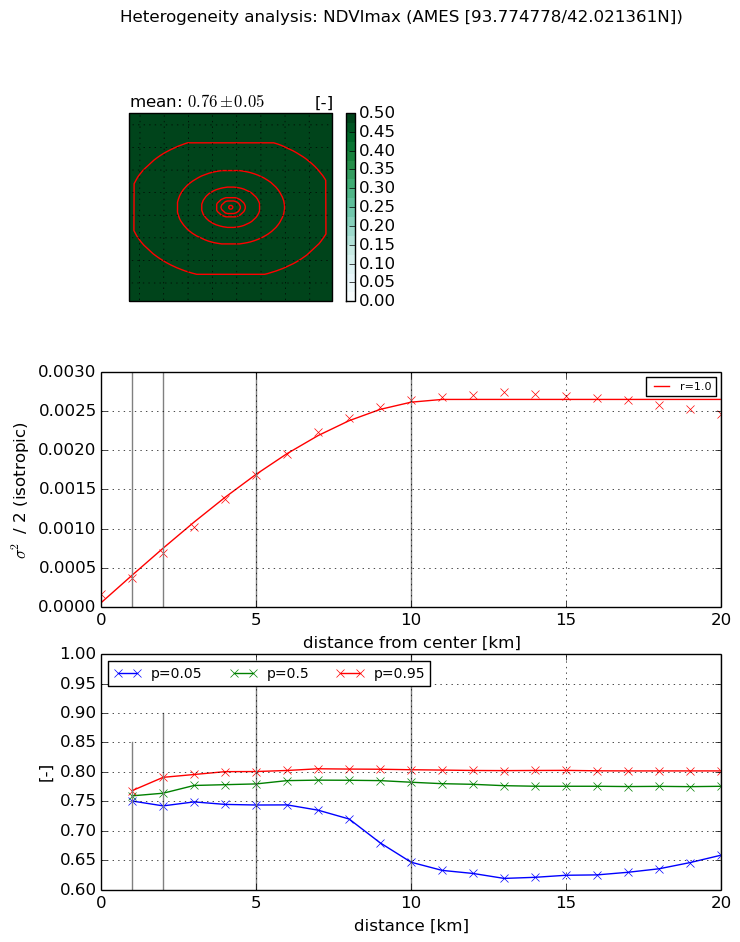
NDVI (max. NDVI composite)


Roman et al. (2009) index


St

2.87374720525

Rcv

0.154319364053

Rse

0.0

Rst

-0.107900971864

Rsv

0.78171282373


NDVI range @ 1km [-]

0.02

NDVI range @ 2km [-]

0.05

NDVI range @ 5km [-]

0.06

NDVI range @ 10km [-]

0.16

NDVI range @ 20km [-]

0.14


Variance slope @ 1 km

0.000203860310833

Variance slope @ 2 km

0.000260779640073

Variance slope @ 5 km

0.000311139682615

Variance slope @ 10 km

0.000265674203531

Variance slope @ 20 km

0.000112892603237


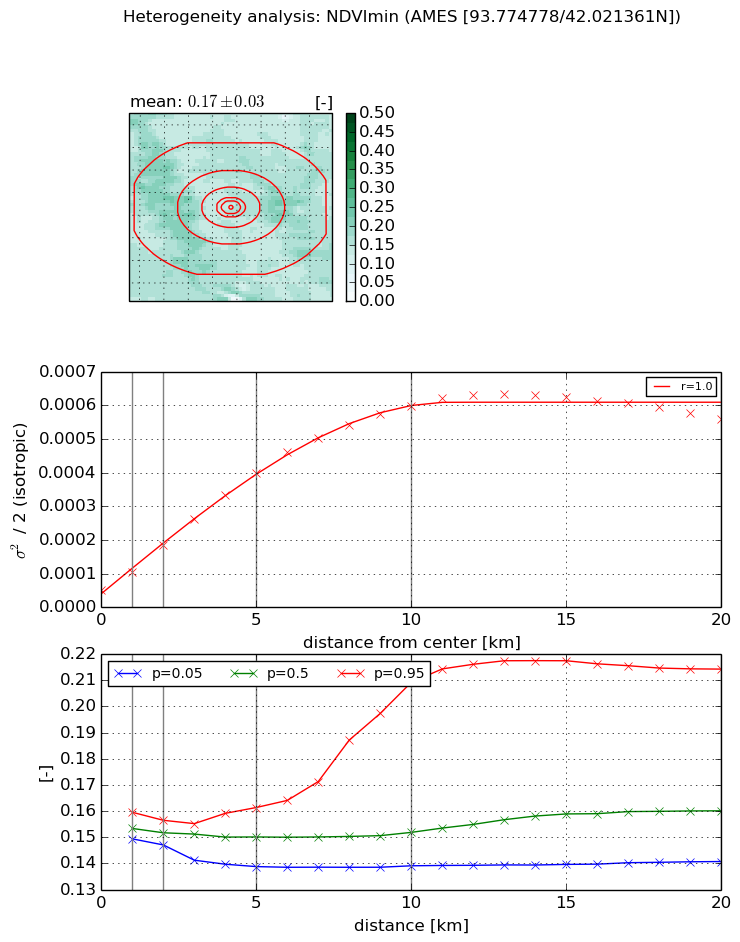
NDVI (min. NDVI composite)I


Roman et al. (2009) index


St

2.91460784036e-07

Rcv

0.497781741242

Rse

0.0

Rst

0.0995762219683

Rsv

10292979.331


NDVI range @ 1km [-]

0.01

NDVI range @ 2km [-]

0.01

NDVI range @ 5km [-]

0.02

NDVI range @ 10km [-]

0.07

NDVI range @ 20km [-]

0.07


NDVI slope @ 1 km

5.47583092438e-05

NDVI slope @ 2 km

6.73442328371e-05

NDVI slope @ 5 km

7.1655418e-05

NDVI slope @ 10 km

5.72591349175e-05

NDVI slope @ 20 km

2.48983470774e-05


Temporal stability analysis

+000 deg (BHR)


BHR statistics

Temporal stability [1/decade]:


abs

rel


Weighted least square:

None


Ordinary least square:

None


Probabilities that GCOS criteria is met:

Weighted least square:

None %

Ordinary least square:

None %


DHR statistics

Temporal stability [1/decade]:


abs

rel


Weighted least square:

None


Ordinary least square:

None


Probabilities that GCOS criteria is met:

Weighted least square:

None %

Ordinary least square:

None %


+057/+063 deg (BHR)


BHR statistics

Temporal stability [1/decade]:


abs

rel


Weighted least square:

None


Ordinary least square:

None


Probabilities that GCOS criteria is met:

Weighted least square:

None %

Ordinary least square:

None %


DHR statistics

Temporal stability [1/decade]:


abs

rel


Weighted least square:

None


Ordinary least square:

None


Probabilities that GCOS criteria is met:

Weighted least square:

None %

Ordinary least square:

None %


Temporal anomaly analyis

The variance of the temporal anomalies provides an additional measure about the stability of the signal AFTER removal of the mean seasonal cylce.

+000 deg


+057/+063 deg