APPALACHIAN_STATE


Location

lon / lat [deg]: -81.6938 / 36.2146

Source network: AERONET


Geostationary surface albedo (GSA) data


“+000”


“+057/+063”


Landcover information (based on ESA CCI landcover data)


Landcover fractions @ 2km distance


Landcover fractions @ 20 km distance


Legend


Distance to open water bodies [km]:

3.53

Distance to urban areas [km]:

0.24


Radius: 1 km

Number of landcover classes:

3

Dominant landcover type:

130: grassland

Fraction of dominant landcover type [%]:

50.0


Radius: 2 km

Number of landcover classes:

3

Dominant landcover type:

130: grassland

Fraction of dominant landcover type [%]:

42.0


Radius: 5 km

Number of landcover classes:

3

Dominant landcover type:

60: Tree cover, broadleaved, decidous

Fraction of dominant landcover type [%]:

51.0


Radius: 10 km

Number of landcover classes:

3

Dominant landcover type:

130: grassland

Fraction of dominant landcover type [%]:

51.0


Radius: 20 km

Number of landcover classes:

3

Dominant landcover type:

60: Tree cover, broadleaved, decidous

Fraction of dominant landcover type [%]:

58.0


Disturbances


Heterogeneity analysis

The heterogeneity analysis provides information about the spatial and temporal heterogeneity of the site.

Topography


Roman et al. (2009) index


St

11.1141433005

Rcv

0.0720839303971

Rse

0.0

Rst

-0.0405712615386

Rsv

0.157271145965


Height range @ 1km [m]

94

Height range @ 2km [m]

204

Height range @ 5km [m]

341

Height range @ 10km [m]

-999

Height range @ 20km [m]

-999


Variance slope @ 1 km

4054

Variance slope @ 2 km

3863

Variance slope @ 5 km

2904

Variance slope @ 10 km

-999

Variance slope @ 20 km

-999


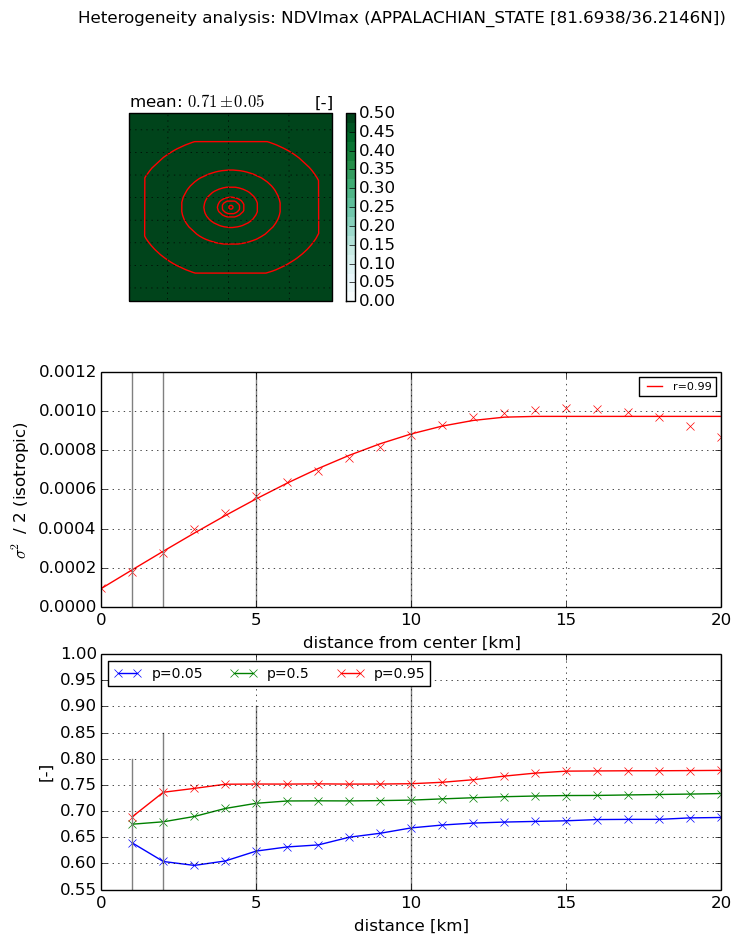
NDVI (max. NDVI composite)


Roman et al. (2009) index


St

7.19856744152

Rcv

-0.11795693429

Rse

0.0

Rst

0.218997602684

Rsv

-0.0797950488808


NDVI range @ 1km [-]

0.05

NDVI range @ 2km [-]

0.13

NDVI range @ 5km [-]

0.13

NDVI range @ 10km [-]

0.08

NDVI range @ 20km [-]

0.09


Variance slope @ 1 km

8.09632670695e-05

Variance slope @ 2 km

8.96389042761e-05

Variance slope @ 5 km

9.64678242242e-05

Variance slope @ 10 km

7.89803813651e-05

Variance slope @ 20 km

4.22314452517e-05


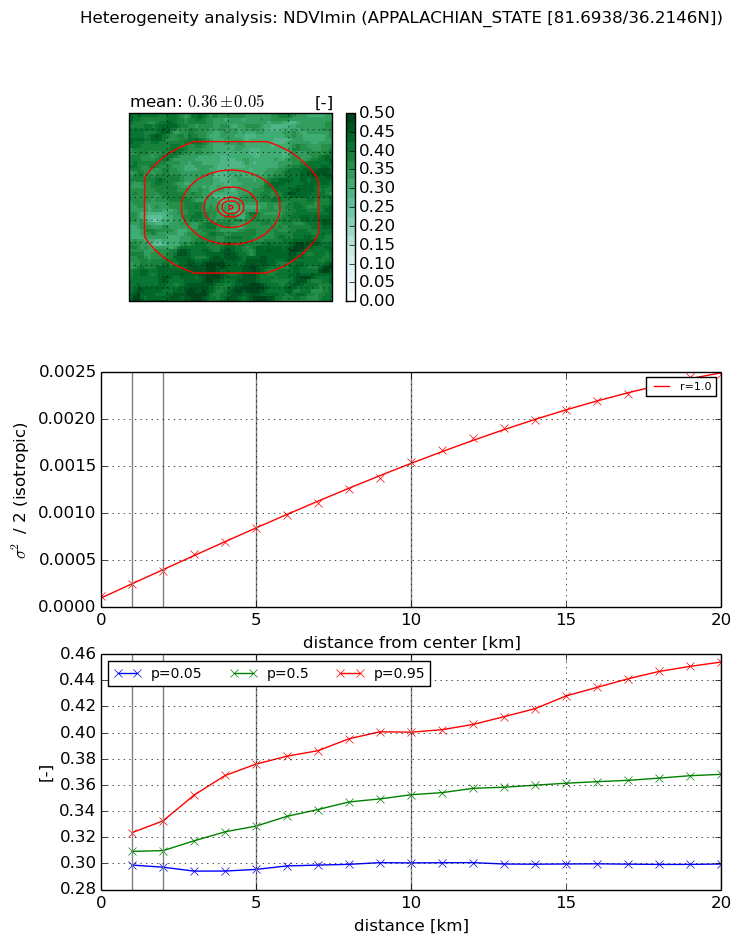
NDVI (min. NDVI composite)I


Roman et al. (2009) index


St

4.08036683698

Rcv

0.461924440915

Rse

0.0

Rst

-0.115698990955

Rsv

0.157604580675


NDVI range @ 1km [-]

0.02

NDVI range @ 2km [-]

0.04

NDVI range @ 5km [-]

0.08

NDVI range @ 10km [-]

0.1

NDVI range @ 20km [-]

0.15


NDVI slope @ 1 km

0.000119704170589

NDVI slope @ 2 km

0.000130373516657

NDVI slope @ 5 km

0.000146459395533

NDVI slope @ 10 km

0.000141665784063

NDVI slope @ 20 km

0.000122264149904


Temporal stability analysis

+000 deg (BHR)


BHR statistics

Temporal stability [1/decade]:


abs

rel


Weighted least square:

None


Ordinary least square:

None


Probabilities that GCOS criteria is met:

Weighted least square:

None %

Ordinary least square:

None %


DHR statistics

Temporal stability [1/decade]:


abs

rel


Weighted least square:

None


Ordinary least square:

None


Probabilities that GCOS criteria is met:

Weighted least square:

None %

Ordinary least square:

None %


+057/+063 deg (BHR)


BHR statistics

Temporal stability [1/decade]:


abs

rel


Weighted least square:

None


Ordinary least square:

None


Probabilities that GCOS criteria is met:

Weighted least square:

None %

Ordinary least square:

None %


DHR statistics

Temporal stability [1/decade]:


abs

rel


Weighted least square:

None


Ordinary least square:

None


Probabilities that GCOS criteria is met:

Weighted least square:

None %

Ordinary least square:

None %


Temporal anomaly analyis

The variance of the temporal anomalies provides an additional measure about the stability of the signal AFTER removal of the mean seasonal cylce.

+000 deg


+057/+063 deg