ARCTIC_LTER_ARC


Location

lon / lat [deg]: -149.6 / 66.63

Source network: LTER


Geostationary surface albedo (GSA) data


“+000”


“+057/+063”


Landcover information (based on ESA CCI landcover data)


Landcover fractions @ 2km distance


Landcover fractions @ 20 km distance


Legend


Distance to open water bodies [km]:

6.71

Distance to urban areas [km]:

none in region


Radius: 1 km

Number of landcover classes:

4

Dominant landcover type:

150: Sparse vegetation (tree, shrub, herbaceous cover) (<15%)

Fraction of dominant landcover type [%]:

61.0


Radius: 2 km

Number of landcover classes:

4

Dominant landcover type:

150: Sparse vegetation (tree, shrub, herbaceous cover) (<15%)

Fraction of dominant landcover type [%]:

56.0


Radius: 5 km

Number of landcover classes:

4

Dominant landcover type:

150: Sparse vegetation (tree, shrub, herbaceous cover) (<15%)

Fraction of dominant landcover type [%]:

51.0


Radius: 10 km

Number of landcover classes:

5

Dominant landcover type:

150: Sparse vegetation (tree, shrub, herbaceous cover) (<15%)

Fraction of dominant landcover type [%]:

51.0


Radius: 20 km

Number of landcover classes:

5

Dominant landcover type:

150: Sparse vegetation (tree, shrub, herbaceous cover) (<15%)

Fraction of dominant landcover type [%]:

56.0


Disturbances


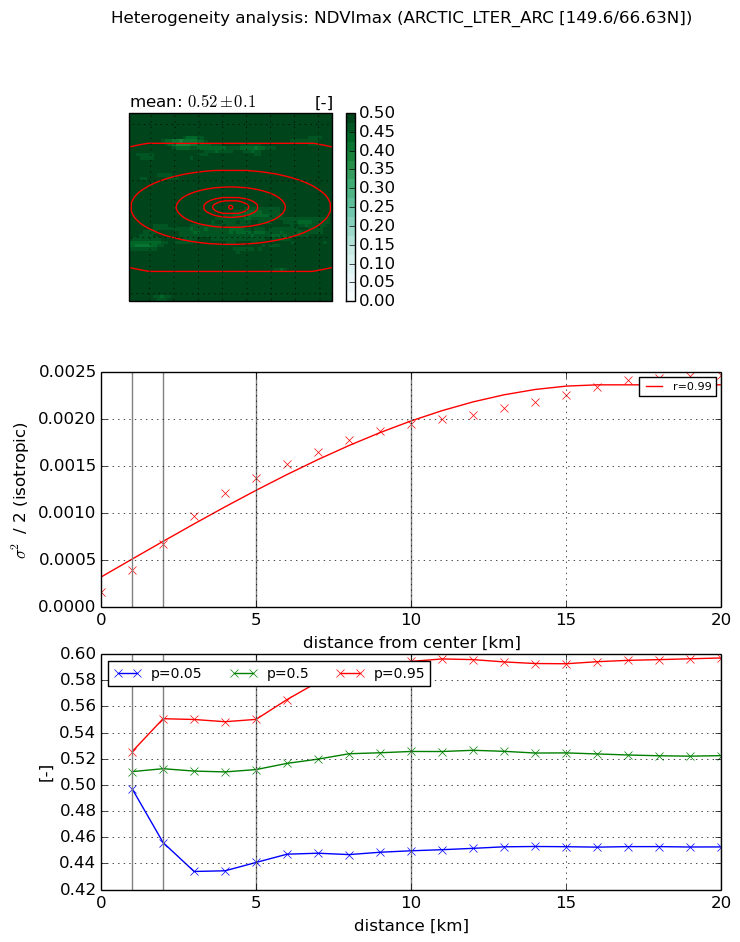
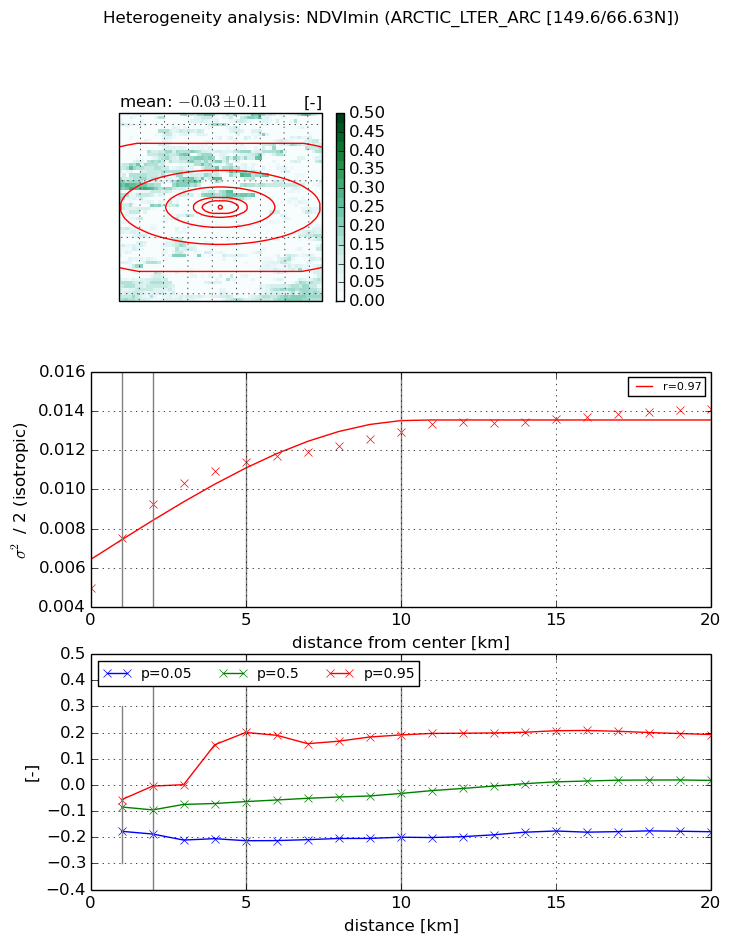
Heterogeneity analysis

The heterogeneity analysis provides information about the spatial and temporal heterogeneity of the site.

Topography


Roman et al. (2009) index


St

9.7451221232

Rcv

0.210656137746

Rse

0.0

Rst

0.093697714196

Rsv

-0.00349246974342


Height range @ 1km [m]

142

Height range @ 2km [m]

242

Height range @ 5km [m]

337

Height range @ 10km [m]

-999

Height range @ 20km [m]

-999


Variance slope @ 1 km

3622

Variance slope @ 2 km

3735

Variance slope @ 5 km

2556

Variance slope @ 10 km

-999

Variance slope @ 20 km

-999


NDVI (max. NDVI composite)


Roman et al. (2009) index


St

6.61290088038

Rcv

-0.00502353642718

Rse

0.0

Rst

-0.0443671315103

Rsv

0.404268029549


NDVI range @ 1km [-]

0.03

NDVI range @ 2km [-]

0.09

NDVI range @ 5km [-]

0.11

NDVI range @ 10km [-]

0.14

NDVI range @ 20km [-]

0.14


Variance slope @ 1 km

0.000228239039325

Variance slope @ 2 km

0.000252452093225

Variance slope @ 5 km

0.000251866606626

Variance slope @ 10 km

0.000180528256861

Variance slope @ 20 km

0.000106152048551


NDVI (min. NDVI composite)I


Roman et al. (2009) index


St

1.10721801625

Rcv

2.01678939314

Rse

0.0

Rst

-0.132532248468

Rsv

0.560171842035


NDVI range @ 1km [-]

0.12

NDVI range @ 2km [-]

0.18

NDVI range @ 5km [-]

0.41

NDVI range @ 10km [-]

0.39

NDVI range @ 20km [-]

0.37


NDVI slope @ 1 km

0.00255825349696

NDVI slope @ 2 km

0.00213469816053

NDVI slope @ 5 km

0.00123475821804

NDVI slope @ 10 km

0.000660504813646

NDVI slope @ 20 km

0.000330058948383


Temporal stability analysis

+000 deg (BHR)


BHR statistics

Temporal stability [1/decade]:


abs

rel


Weighted least square:

None


Ordinary least square:

None


Probabilities that GCOS criteria is met:

Weighted least square:

None %

Ordinary least square:

None %


DHR statistics

Temporal stability [1/decade]:


abs

rel


Weighted least square:

None


Ordinary least square:

None


Probabilities that GCOS criteria is met:

Weighted least square:

None %

Ordinary least square:

None %


+057/+063 deg (BHR)


BHR statistics

Temporal stability [1/decade]:


abs

rel


Weighted least square:

None


Ordinary least square:

None


Probabilities that GCOS criteria is met:

Weighted least square:

None %

Ordinary least square:

None %


DHR statistics

Temporal stability [1/decade]:


abs

rel


Weighted least square:

None


Ordinary least square:

None


Probabilities that GCOS criteria is met:

Weighted least square:

None %

Ordinary least square:

None %


Temporal anomaly analyis

The variance of the temporal anomalies provides an additional measure about the stability of the signal AFTER removal of the mean seasonal cylce.

+000 deg


+057/+063 deg