ARIZONA


Location

lon / lat [deg]: -110.788 / 32.442

Source network: AERONET


Geostationary surface albedo (GSA) data


“+000”


“+057/+063”


Landcover information (based on ESA CCI landcover data)


Landcover fractions @ 2km distance


Landcover fractions @ 20 km distance


Legend


Distance to open water bodies [km]:

8.68

Distance to urban areas [km]:

10.81


Radius: 1 km

Number of landcover classes:

1

Dominant landcover type:

70: Tree cover, needleleaved, evergreen, closed to open (>15%)

Fraction of dominant landcover type [%]:

100.0


Radius: 2 km

Number of landcover classes:

3

Dominant landcover type:

70: Tree cover, needleleaved, evergreen, closed to open (>15%)

Fraction of dominant landcover type [%]:

96.0


Radius: 5 km

Number of landcover classes:

5

Dominant landcover type:

70: Tree cover, needleleaved, evergreen, closed to open (>15%)

Fraction of dominant landcover type [%]:

86.0


Radius: 10 km

Number of landcover classes:

5

Dominant landcover type:

70: Tree cover, needleleaved, evergreen, closed to open (>15%)

Fraction of dominant landcover type [%]:

47.0


Radius: 20 km

Number of landcover classes:

4

Dominant landcover type:

120: Shrubland

Fraction of dominant landcover type [%]:

71.0


Disturbances


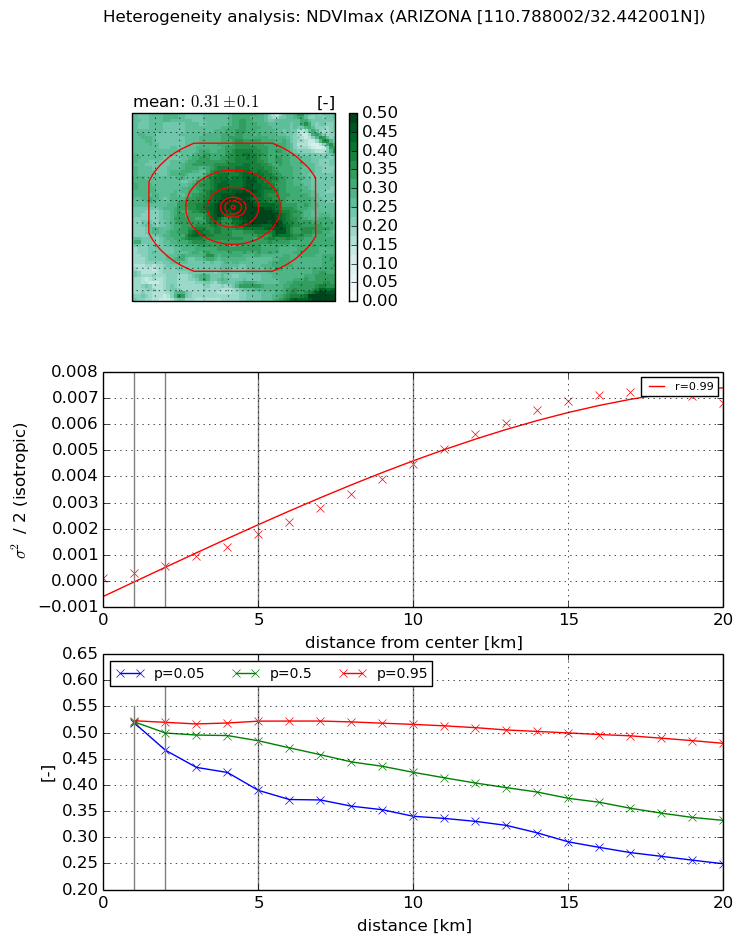
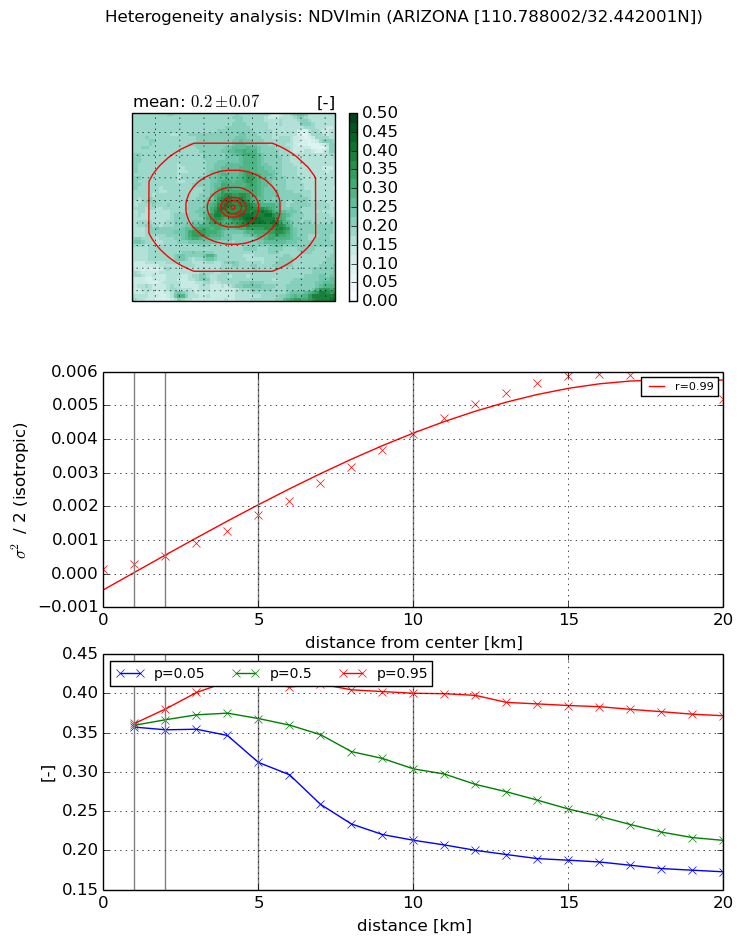
Heterogeneity analysis

The heterogeneity analysis provides information about the spatial and temporal heterogeneity of the site.

Topography


Roman et al. (2009) index


St

2.34040148148

Rcv

0.436379039272

Rse

0.0

Rst

-0.047936292851

Rsv

0.797516021917


Height range @ 1km [m]

265

Height range @ 2km [m]

528

Height range @ 5km [m]

936

Height range @ 10km [m]

-999

Height range @ 20km [m]

-999


Variance slope @ 1 km

20785

Variance slope @ 2 km

25893

Variance slope @ 5 km

27117

Variance slope @ 10 km

-999

Variance slope @ 20 km

-999


NDVI (max. NDVI composite)


Roman et al. (2009) index


St

1.1475704224

Rcv

0.587973719436

Rse

0.0

Rst

-0.235512725646

Rsv

1.79073220456


NDVI range @ 1km [-]

0.0

NDVI range @ 2km [-]

0.05

NDVI range @ 5km [-]

0.13

NDVI range @ 10km [-]

0.18

NDVI range @ 20km [-]

0.23


Variance slope @ 1 km

0.00018213743145

Variance slope @ 2 km

0.000213215980869

Variance slope @ 5 km

0.000335853665289

Variance slope @ 10 km

0.000444464081295

Variance slope @ 20 km

0.000412646020315


NDVI (min. NDVI composite)I


Roman et al. (2009) index


St

nan

Rcv

nan

Rse

nan

Rst

nan

Rsv

nan


NDVI range @ 1km [-]

0.0

NDVI range @ 2km [-]

0.03

NDVI range @ 5km [-]

0.1

NDVI range @ 10km [-]

0.19

NDVI range @ 20km [-]

0.2


NDVI slope @ 1 km

0.000170304572828

NDVI slope @ 2 km

0.000202204115836

NDVI slope @ 5 km

0.000326368597565

NDVI slope @ 10 km

0.000419829456838

NDVI slope @ 20 km

0.000324367633128


Temporal stability analysis

+000 deg (BHR)


BHR statistics

Temporal stability [1/decade]:


abs

rel


Weighted least square:

None


Ordinary least square:

None


Probabilities that GCOS criteria is met:

Weighted least square:

None %

Ordinary least square:

None %


DHR statistics

Temporal stability [1/decade]:


abs

rel


Weighted least square:

None


Ordinary least square:

None


Probabilities that GCOS criteria is met:

Weighted least square:

None %

Ordinary least square:

None %


+057/+063 deg (BHR)


BHR statistics

Temporal stability [1/decade]:


abs

rel


Weighted least square:

None


Ordinary least square:

None


Probabilities that GCOS criteria is met:

Weighted least square:

None %

Ordinary least square:

None %


DHR statistics

Temporal stability [1/decade]:


abs

rel


Weighted least square:

None


Ordinary least square:

None


Probabilities that GCOS criteria is met:

Weighted least square:

None %

Ordinary least square:

None %


Temporal anomaly analyis

The variance of the temporal anomalies provides an additional measure about the stability of the signal AFTER removal of the mean seasonal cylce.

+000 deg


+057/+063 deg