ARM_HYYTIALAFINLAND


Location

lon / lat [deg]: 24.2878 / 61.8435

Source network: AERONET


Geostationary surface albedo (GSA) data


“+000”


“+057/+063”


Landcover information (based on ESA CCI landcover data)


Landcover fractions @ 2km distance


Landcover fractions @ 20 km distance


Legend


Distance to open water bodies [km]:

0.17

Distance to urban areas [km]:

2.57


Radius: 1 km

Number of landcover classes:

4

Dominant landcover type:

70: Tree cover, needleleaved, evergreen, closed to open (>15%)

Fraction of dominant landcover type [%]:

83.0


Radius: 2 km

Number of landcover classes:

4

Dominant landcover type:

70: Tree cover, needleleaved, evergreen, closed to open (>15%)

Fraction of dominant landcover type [%]:

88.0


Radius: 5 km

Number of landcover classes:

5

Dominant landcover type:

70: Tree cover, needleleaved, evergreen, closed to open (>15%)

Fraction of dominant landcover type [%]:

91.0


Radius: 10 km

Number of landcover classes:

7

Dominant landcover type:

70: Tree cover, needleleaved, evergreen, closed to open (>15%)

Fraction of dominant landcover type [%]:

82.0


Radius: 20 km

Number of landcover classes:

7

Dominant landcover type:

70: Tree cover, needleleaved, evergreen, closed to open (>15%)

Fraction of dominant landcover type [%]:

71.0


Disturbances


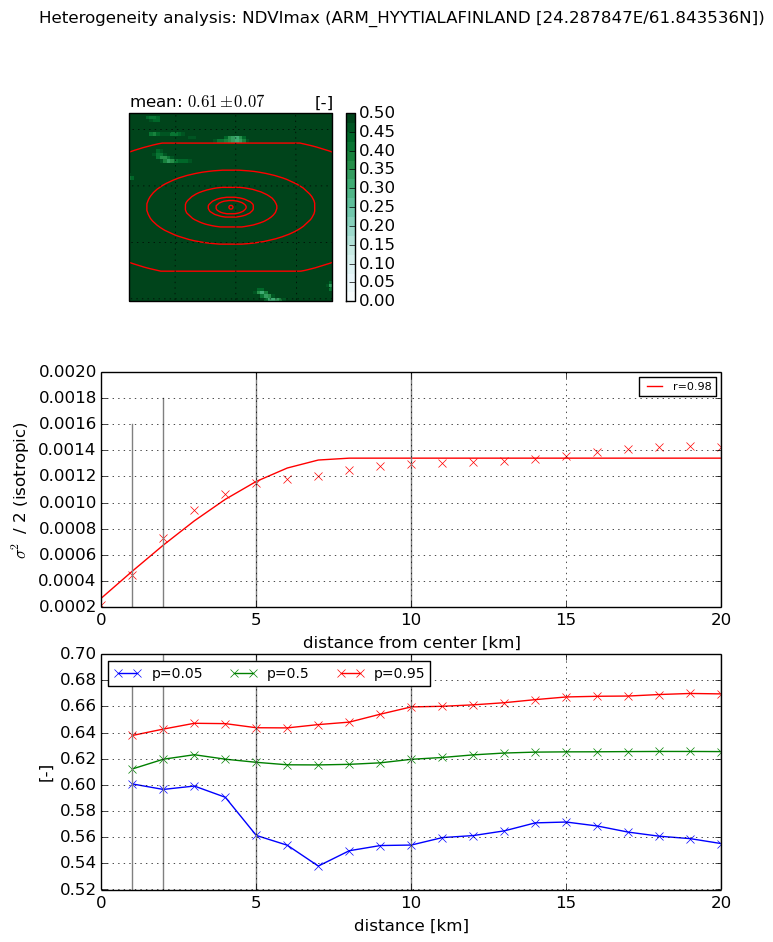
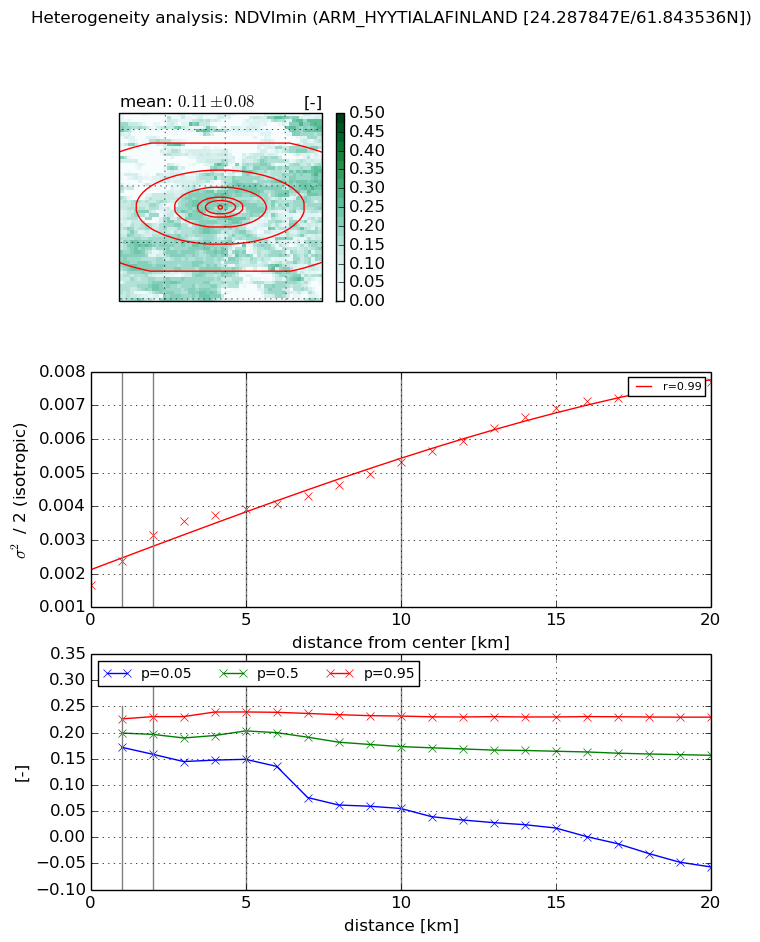
Heterogeneity analysis

The heterogeneity analysis provides information about the spatial and temporal heterogeneity of the site.

Topography


Roman et al. (2009) index


St

1.95894028714

Rcv

0.0153023667103

Rse

0.0

Rst

-0.183355813606

Rsv

1.33278206811


Height range @ 1km [m]

51

Height range @ 2km [m]

49

Height range @ 5km [m]

44

Height range @ 10km [m]

-999

Height range @ 20km [m]

-999


Variance slope @ 1 km

91

Variance slope @ 2 km

71

Variance slope @ 5 km

39

Variance slope @ 10 km

-999

Variance slope @ 20 km

-999


NDVI (max. NDVI composite)


Roman et al. (2009) index


St

0.0353409171541

Rcv

0.560448381713

Rse

0.0

Rst

7.49844120047e-09

Rsv

84.3269920504


NDVI range @ 1km [-]

0.04

NDVI range @ 2km [-]

0.05

NDVI range @ 5km [-]

0.08

NDVI range @ 10km [-]

0.11

NDVI range @ 20km [-]

0.11


Variance slope @ 1 km

0.000226069910487

Variance slope @ 2 km

0.00025700456044

Variance slope @ 5 km

0.000191737887853

Variance slope @ 10 km

9.91877019219e-05

Variance slope @ 20 km

4.40935849056e-05


NDVI (min. NDVI composite)I


Roman et al. (2009) index


St

2.87947549236

Rcv

-0.17373213307

Rse

0.0

Rst

0.363862716819

Rsv

-0.504261560403


NDVI range @ 1km [-]

0.05

NDVI range @ 2km [-]

0.07

NDVI range @ 5km [-]

0.09

NDVI range @ 10km [-]

0.18

NDVI range @ 20km [-]

0.29


NDVI slope @ 1 km

0.000732957028745

NDVI slope @ 2 km

0.000749159567165

NDVI slope @ 5 km

0.000454491152251

NDVI slope @ 10 km

0.000316859305733

NDVI slope @ 20 km

0.000288139658611


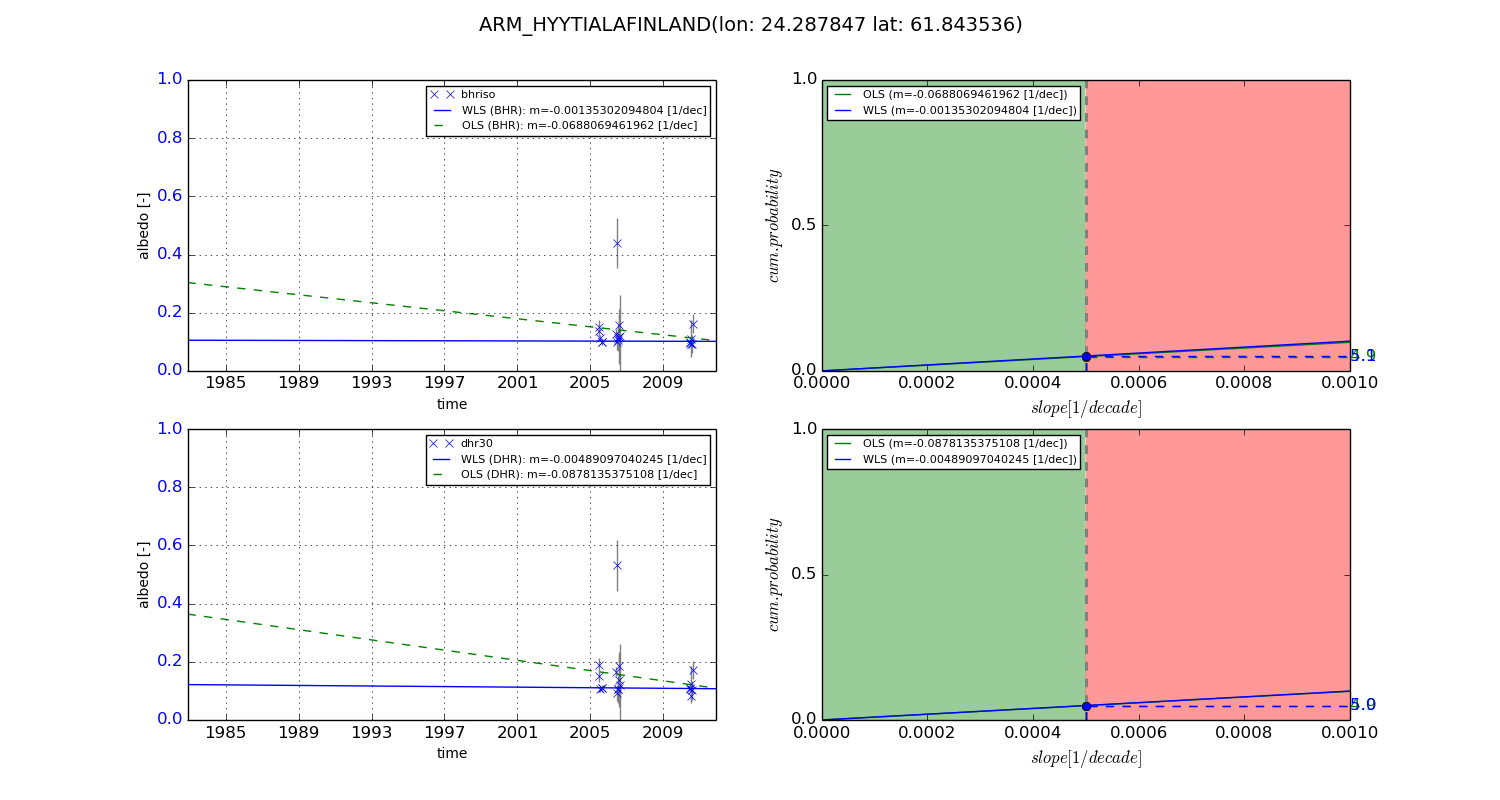
Temporal stability analysis

+000 deg (BHR)


BHR statistics

Temporal stability [1/decade]:


abs

rel


Weighted least square:

-99999.0


Ordinary least square:

-99999.0


Probabilities that GCOS criteria is met:

Weighted least square:

-99999.0 %

Ordinary least square:

-99999.0 %


DHR statistics

Temporal stability [1/decade]:


abs

rel


Weighted least square:

-99999.0


Ordinary least square:

-99999.0


Probabilities that GCOS criteria is met:

Weighted least square:

-99999.0 %

Ordinary least square:

-99999.0 %


+057/+063 deg (BHR)


BHR statistics

Temporal stability [1/decade]:


abs

rel


Weighted least square:

-0.00135302094804


Ordinary least square:

-0.0688069461962


Probabilities that GCOS criteria is met:

Weighted least square:

5.1 %

Ordinary least square:

4.9 %


DHR statistics

Temporal stability [1/decade]:


abs

rel


Weighted least square:

-0.00489097040245


Ordinary least square:

-0.0878135375108


Probabilities that GCOS criteria is met:

Weighted least square:

5.0 %

Ordinary least square:

4.9 %


Temporal anomaly analyis

The variance of the temporal anomalies provides an additional measure about the stability of the signal AFTER removal of the mean seasonal cylce.

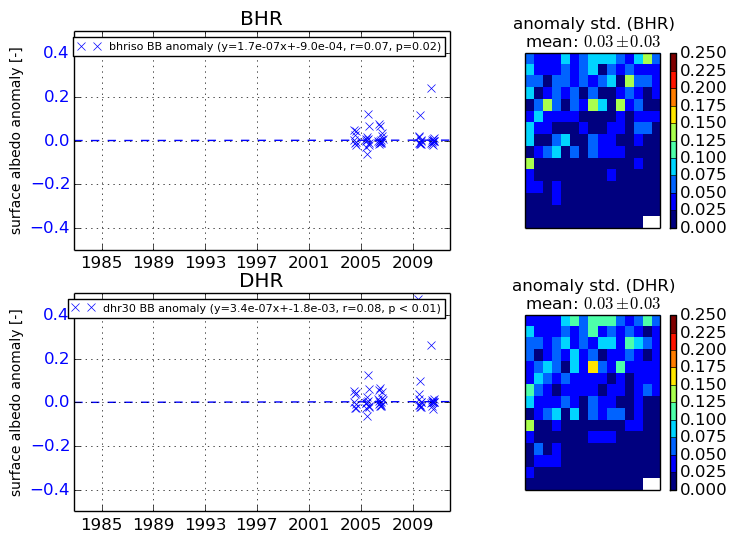
+000 deg


+057/+063 deg