ASIA1


Location

lon / lat [deg]: 87.65 / 43.7833

Source network: AERONET


Geostationary surface albedo (GSA) data


“+000”


“+057/+063”


Landcover information (based on ESA CCI landcover data)


Landcover fractions @ 2km distance


Landcover fractions @ 20 km distance


Legend


Distance to open water bodies [km]:

4.22

Distance to urban areas [km]:

0.19


Radius: 1 km

Number of landcover classes:

1

Dominant landcover type:

190: urban areas

Fraction of dominant landcover type [%]:

100.0


Radius: 2 km

Number of landcover classes:

2

Dominant landcover type:

190: urban areas

Fraction of dominant landcover type [%]:

96.0


Radius: 5 km

Number of landcover classes:

4

Dominant landcover type:

190: urban areas

Fraction of dominant landcover type [%]:

74.0


Radius: 10 km

Number of landcover classes:

7

Dominant landcover type:

190: urban areas

Fraction of dominant landcover type [%]:

48.0


Radius: 20 km

Number of landcover classes:

8

Dominant landcover type:

200: bare areas

Fraction of dominant landcover type [%]:

36.0


Disturbances


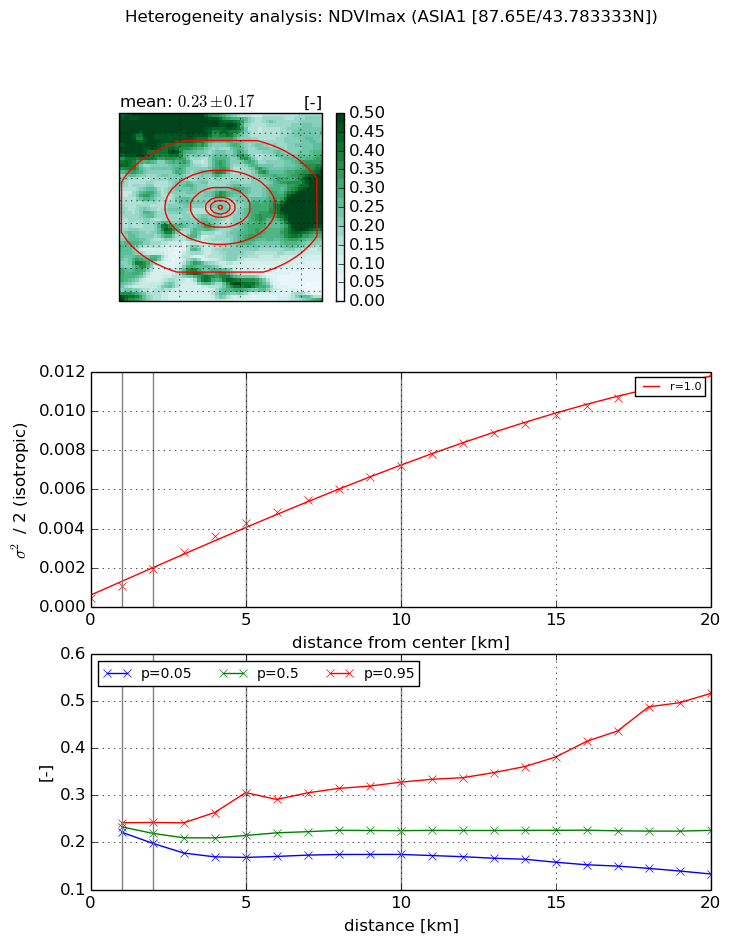
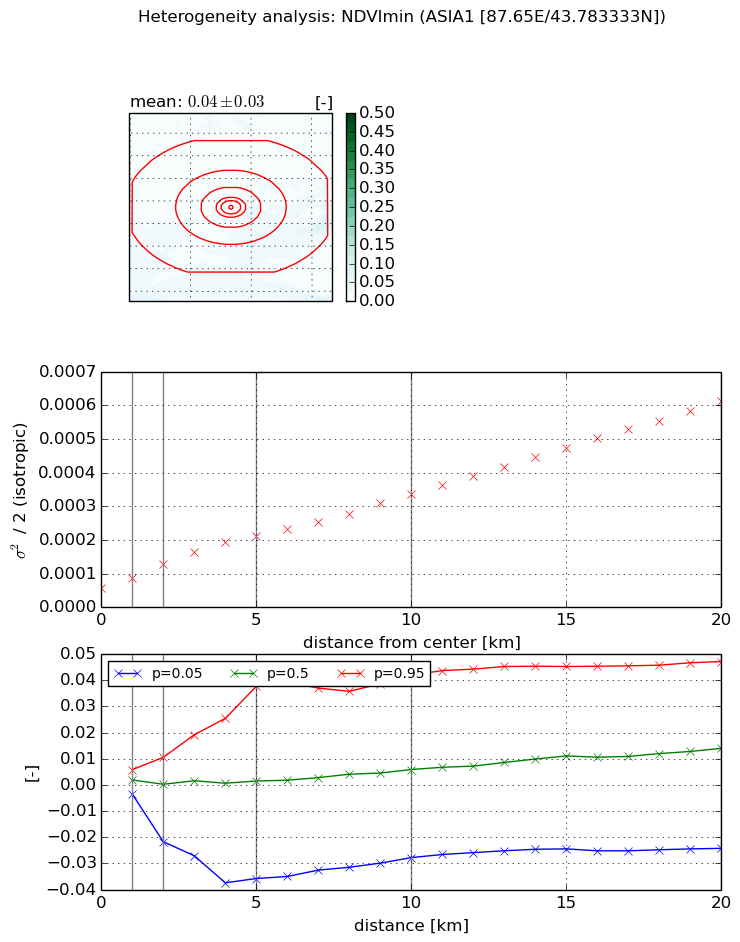
Heterogeneity analysis

The heterogeneity analysis provides information about the spatial and temporal heterogeneity of the site.

Topography


Roman et al. (2009) index


St

0.0527363570946

Rcv

0.540087770804

Rse

0.0

Rst

1.18852994946e-05

Rsv

56.3466510654


Height range @ 1km [m]

61

Height range @ 2km [m]

93

Height range @ 5km [m]

180

Height range @ 10km [m]

-999

Height range @ 20km [m]

-999


Variance slope @ 1 km

546

Variance slope @ 2 km

610

Variance slope @ 5 km

878

Variance slope @ 10 km

-999

Variance slope @ 20 km

-999


NDVI (max. NDVI composite)


Roman et al. (2009) index


St

0.847080937526

Rcv

0.915057396952

Rse

0.0

Rst

-0.345070997389

Rsv

2.28144581315


NDVI range @ 1km [-]

0.02

NDVI range @ 2km [-]

0.04

NDVI range @ 5km [-]

0.14

NDVI range @ 10km [-]

0.15

NDVI range @ 20km [-]

0.38


Variance slope @ 1 km

0.000586811954386

Variance slope @ 2 km

0.00073773598924

Variance slope @ 5 km

0.000785867512031

Variance slope @ 10 km

0.00067936289534

Variance slope @ 20 km

0.000569801762202


NDVI (min. NDVI composite)I


Roman et al. (2009) index


St

1.14283395542e-07

Rcv

7.75024883074

Rse

0.0

Rst

0.741955317842

Rsv

26250524.1051


NDVI range @ 1km [-]

0.01

NDVI range @ 2km [-]

0.03

NDVI range @ 5km [-]

0.07

NDVI range @ 10km [-]

0.07

NDVI range @ 20km [-]

0.07


NDVI slope @ 1 km

3.12483874373e-05

NDVI slope @ 2 km

3.58388352682e-05

NDVI slope @ 5 km

3.23183356755e-05

NDVI slope @ 10 km

2.68931620997e-05

NDVI slope @ 20 km

2.69966992049e-05


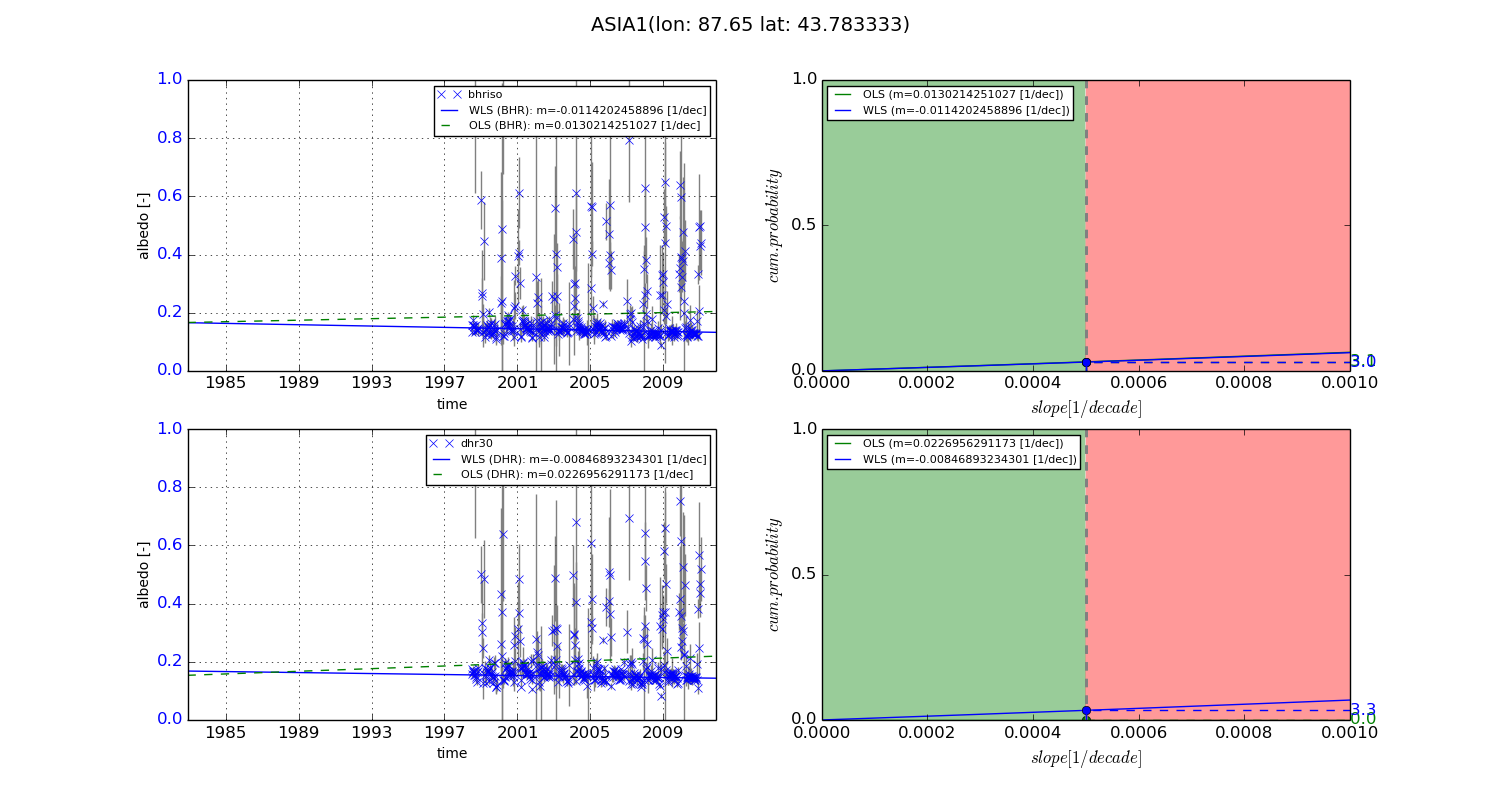
Temporal stability analysis

+000 deg (BHR)


BHR statistics

Temporal stability [1/decade]:


abs

rel


Weighted least square:

None


Ordinary least square:

None


Probabilities that GCOS criteria is met:

Weighted least square:

None %

Ordinary least square:

None %


DHR statistics

Temporal stability [1/decade]:


abs

rel


Weighted least square:

None


Ordinary least square:

None


Probabilities that GCOS criteria is met:

Weighted least square:

None %

Ordinary least square:

None %


+057/+063 deg (BHR)


BHR statistics

Temporal stability [1/decade]:


abs

rel


Weighted least square:

-0.0114202458896


Ordinary least square:

0.0130214251027


Probabilities that GCOS criteria is met:

Weighted least square:

3.0 %

Ordinary least square:

3.1 %


DHR statistics

Temporal stability [1/decade]:


abs

rel


Weighted least square:

-0.00846893234301


Ordinary least square:

0.0226956291173


Probabilities that GCOS criteria is met:

Weighted least square:

3.3 %

Ordinary least square:

0.0 %


Temporal anomaly analyis

The variance of the temporal anomalies provides an additional measure about the stability of the signal AFTER removal of the mean seasonal cylce.

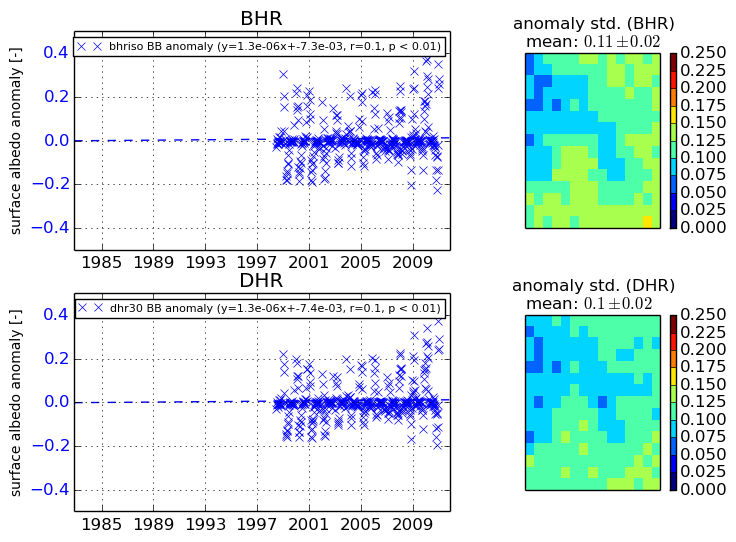
+000 deg


+057/+063 deg