ASMARA


Location

lon / lat [deg]: 38.9224 / 15.3429

Source network: AERONET


Geostationary surface albedo (GSA) data


“+000”


“+057/+063”


Landcover information (based on ESA CCI landcover data)


Landcover fractions @ 2km distance


Landcover fractions @ 20 km distance


Legend


Distance to open water bodies [km]:

7.03

Distance to urban areas [km]:

0.13


Radius: 1 km

Number of landcover classes:

2

Dominant landcover type:

190: urban areas

Fraction of dominant landcover type [%]:

94.0


Radius: 2 km

Number of landcover classes:

5

Dominant landcover type:

190: urban areas

Fraction of dominant landcover type [%]:

74.0


Radius: 5 km

Number of landcover classes:

5

Dominant landcover type:

190: urban areas

Fraction of dominant landcover type [%]:

44.0


Radius: 10 km

Number of landcover classes:

5

Dominant landcover type:

10: cropland, rainfed

Fraction of dominant landcover type [%]:

68.0


Radius: 20 km

Number of landcover classes:

8

Dominant landcover type:

10: cropland, rainfed

Fraction of dominant landcover type [%]:

80.0


Disturbances


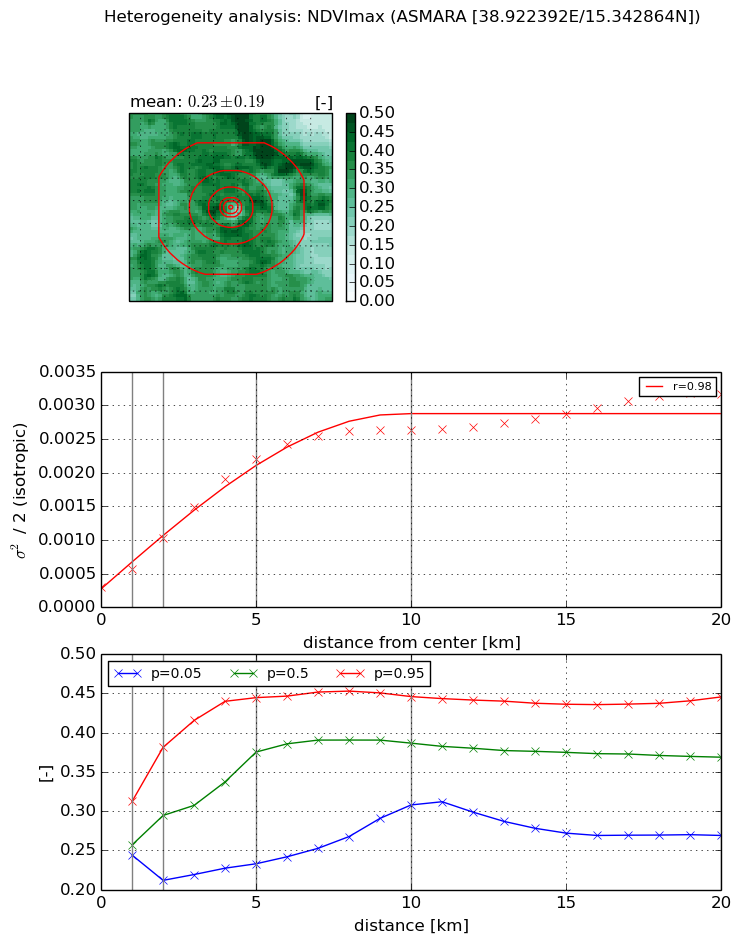
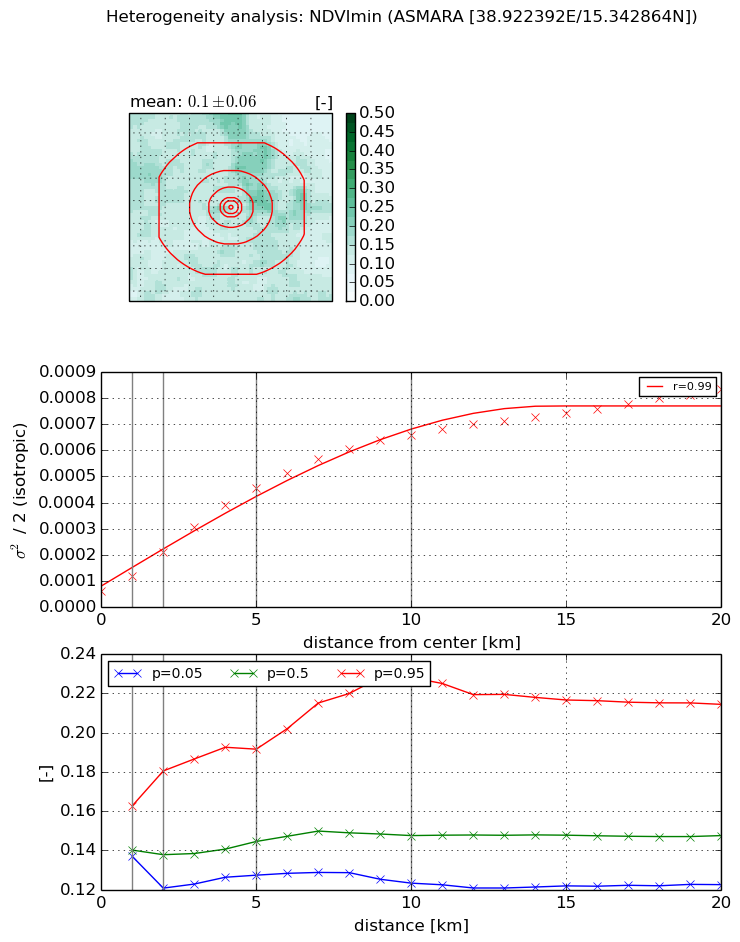
Heterogeneity analysis

The heterogeneity analysis provides information about the spatial and temporal heterogeneity of the site.

Topography


Roman et al. (2009) index


St

0.157588825558

Rcv

1.14937599484

Rse

0.0

Rst

2.89619544734e-07

Rsv

17.8875064981


Height range @ 1km [m]

36

Height range @ 2km [m]

38

Height range @ 5km [m]

102

Height range @ 10km [m]

-999

Height range @ 20km [m]

-999


Variance slope @ 1 km

405

Variance slope @ 2 km

266

Variance slope @ 5 km

171

Variance slope @ 10 km

-999

Variance slope @ 20 km

-999


NDVI (max. NDVI composite)


Roman et al. (2009) index


St

3.91178680811

Rcv

-0.176150733315

Rse

0.0

Rst

0.187288010006

Rsv

-0.403474216706


NDVI range @ 1km [-]

0.07

NDVI range @ 2km [-]

0.17

NDVI range @ 5km [-]

0.21

NDVI range @ 10km [-]

0.14

NDVI range @ 20km [-]

0.18


Variance slope @ 1 km

0.000270829728857

Variance slope @ 2 km

0.000366537077295

Variance slope @ 5 km

0.000400303196925

Variance slope @ 10 km

0.000249480918315

Variance slope @ 20 km

0.000119739700164


NDVI (min. NDVI composite)I


Roman et al. (2009) index


St

12.9906471007

Rcv

-0.0480574211356

Rse

0.0

Rst

-0.118668983891

Rsv

-0.0642089730756


NDVI range @ 1km [-]

0.03

NDVI range @ 2km [-]

0.06

NDVI range @ 5km [-]

0.06

NDVI range @ 10km [-]

0.1

NDVI range @ 20km [-]

0.09


NDVI slope @ 1 km

5.55632630159e-05

NDVI slope @ 2 km

7.39775284612e-05

NDVI slope @ 5 km

8.20217313136e-05

NDVI slope @ 10 km

6.2747113275e-05

NDVI slope @ 20 km

3.52699540486e-05


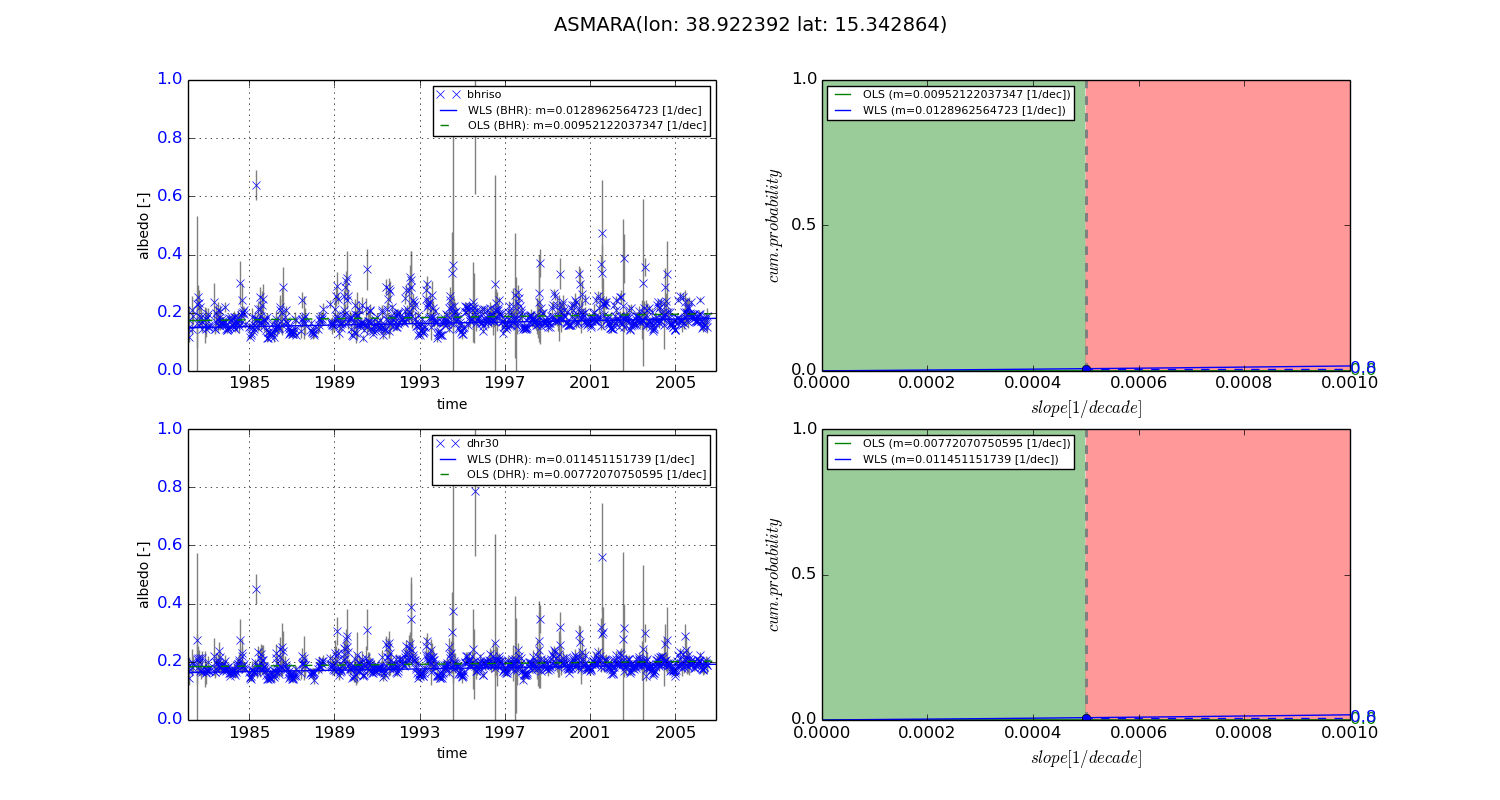
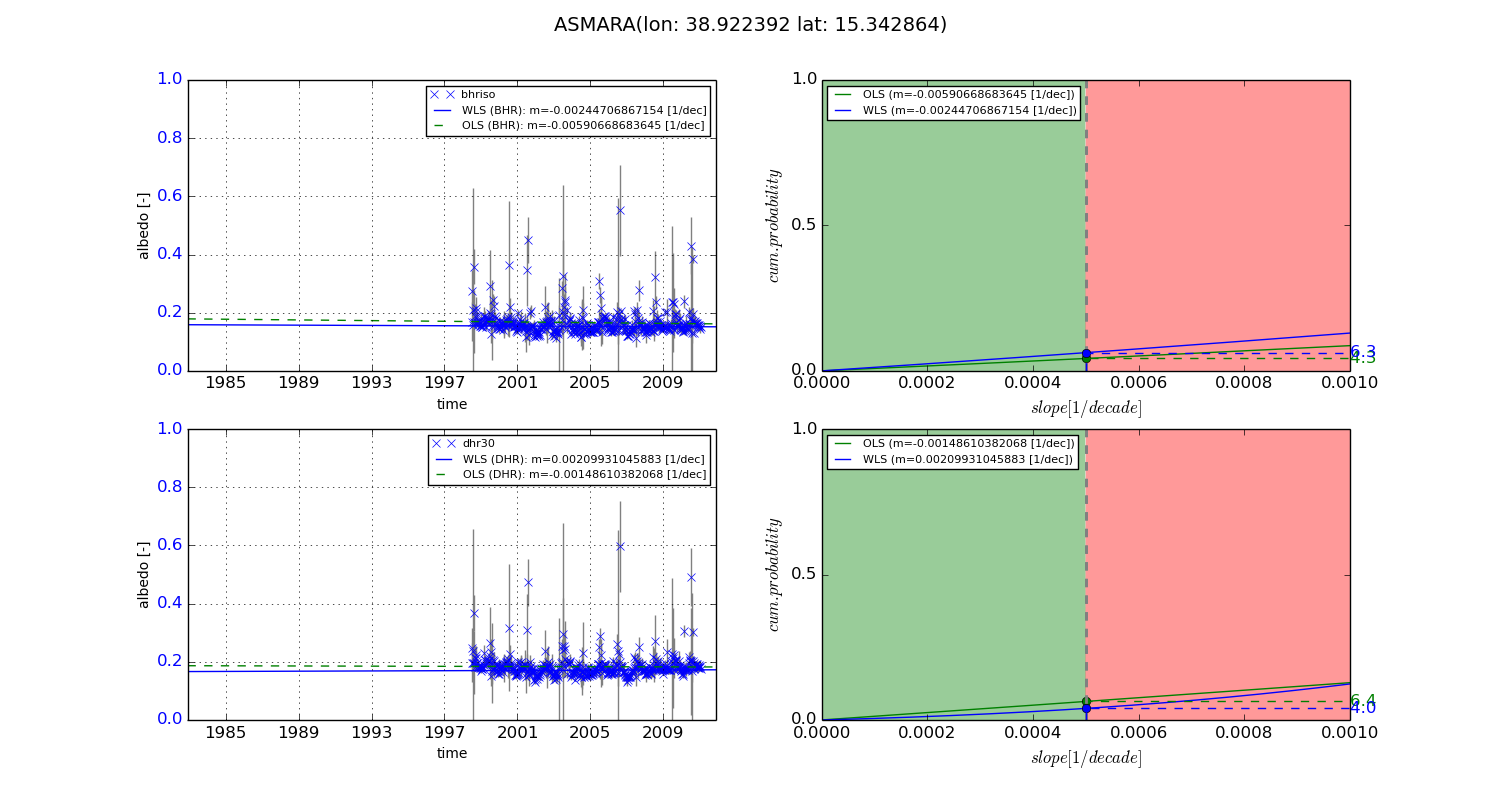
Temporal stability analysis

+000 deg (BHR)


BHR statistics

Temporal stability [1/decade]:


abs

rel


Weighted least square:

0.0128962564723


Ordinary least square:

0.00952122037347


Probabilities that GCOS criteria is met:

Weighted least square:

0.8 %

Ordinary least square:

0.0 %


DHR statistics

Temporal stability [1/decade]:


abs

rel


Weighted least square:

0.011451151739


Ordinary least square:

0.00772070750595


Probabilities that GCOS criteria is met:

Weighted least square:

0.8 %

Ordinary least square:

0.0 %


+057/+063 deg (BHR)


BHR statistics

Temporal stability [1/decade]:


abs

rel


Weighted least square:

-0.00244706867154


Ordinary least square:

-0.00590668683645


Probabilities that GCOS criteria is met:

Weighted least square:

6.3 %

Ordinary least square:

4.3 %


DHR statistics

Temporal stability [1/decade]:


abs

rel


Weighted least square:

0.00209931045883


Ordinary least square:

-0.00148610382068


Probabilities that GCOS criteria is met:

Weighted least square:

4.0 %

Ordinary least square:

6.4 %


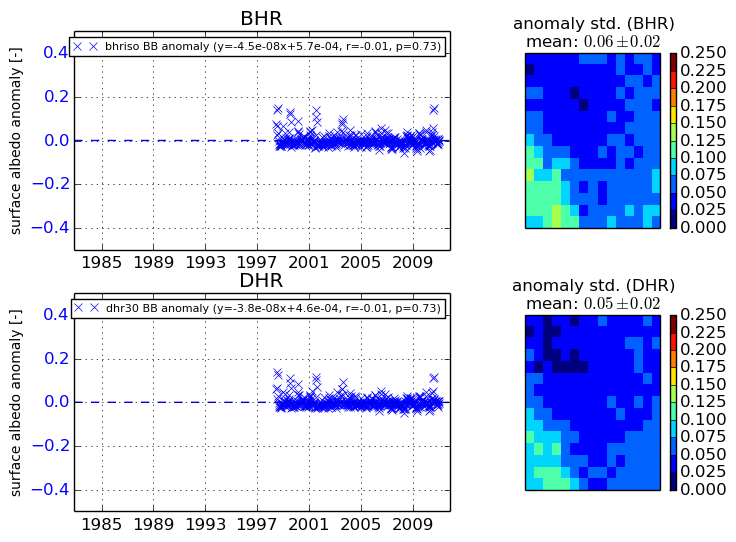
Temporal anomaly analyis

The variance of the temporal anomalies provides an additional measure about the stability of the signal AFTER removal of the mean seasonal cylce.
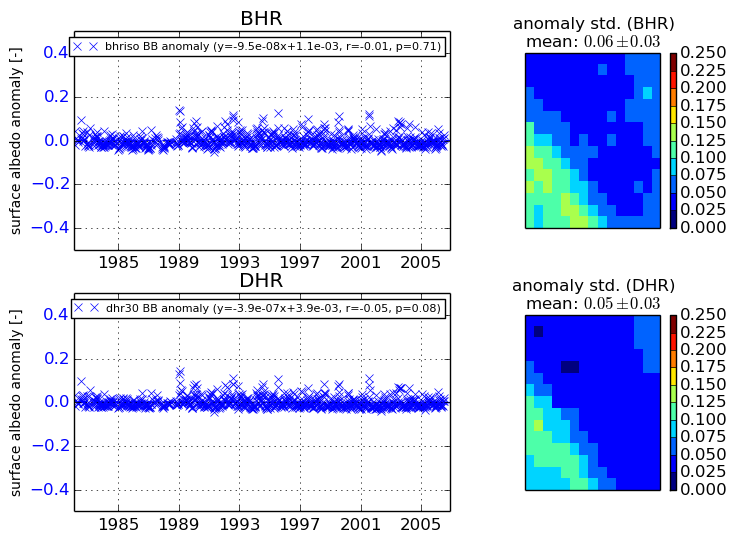
+000 deg


+057/+063 deg