ASPET


Location

lon / lat [deg]: 0.795 / 43.025

Source network: AERONET


Geostationary surface albedo (GSA) data


“+000”


“+057/+063”


Landcover information (based on ESA CCI landcover data)


Landcover fractions @ 2km distance


Landcover fractions @ 20 km distance


Legend


Distance to open water bodies [km]:

11.59

Distance to urban areas [km]:

0.17


Radius: 1 km

Number of landcover classes:

4

Dominant landcover type:

130: grassland

Fraction of dominant landcover type [%]:

46.0


Radius: 2 km

Number of landcover classes:

6

Dominant landcover type:

60: Tree cover, broadleaved, decidous

Fraction of dominant landcover type [%]:

60.0


Radius: 5 km

Number of landcover classes:

5

Dominant landcover type:

60: Tree cover, broadleaved, decidous

Fraction of dominant landcover type [%]:

63.0


Radius: 10 km

Number of landcover classes:

6

Dominant landcover type:

60: Tree cover, broadleaved, decidous

Fraction of dominant landcover type [%]:

64.0


Radius: 20 km

Number of landcover classes:

7

Dominant landcover type:

60: Tree cover, broadleaved, decidous

Fraction of dominant landcover type [%]:

52.0


Disturbances


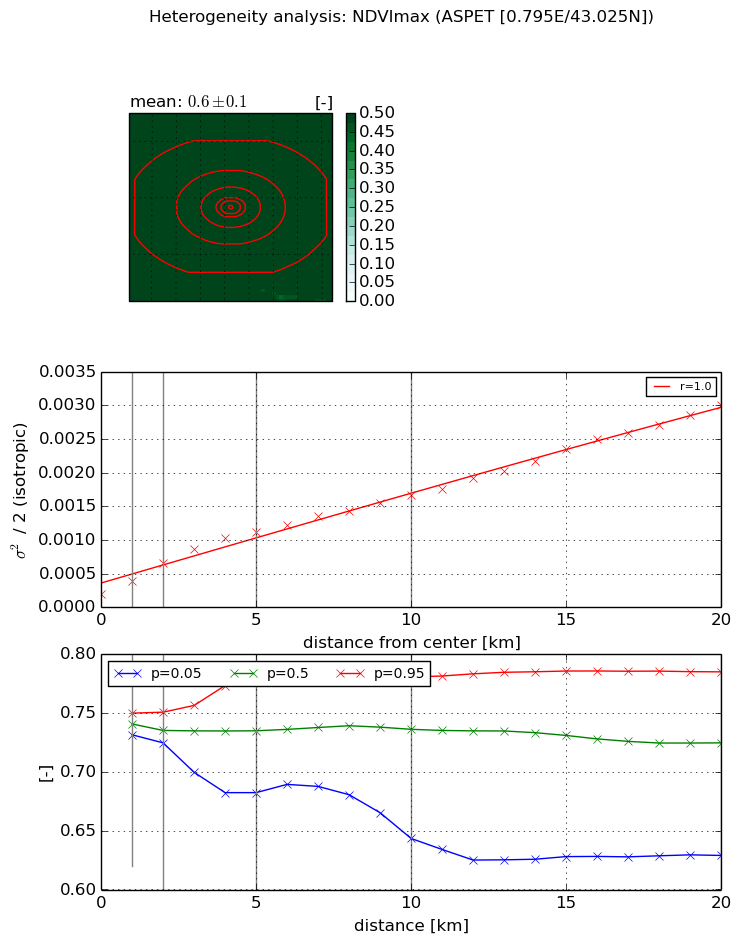
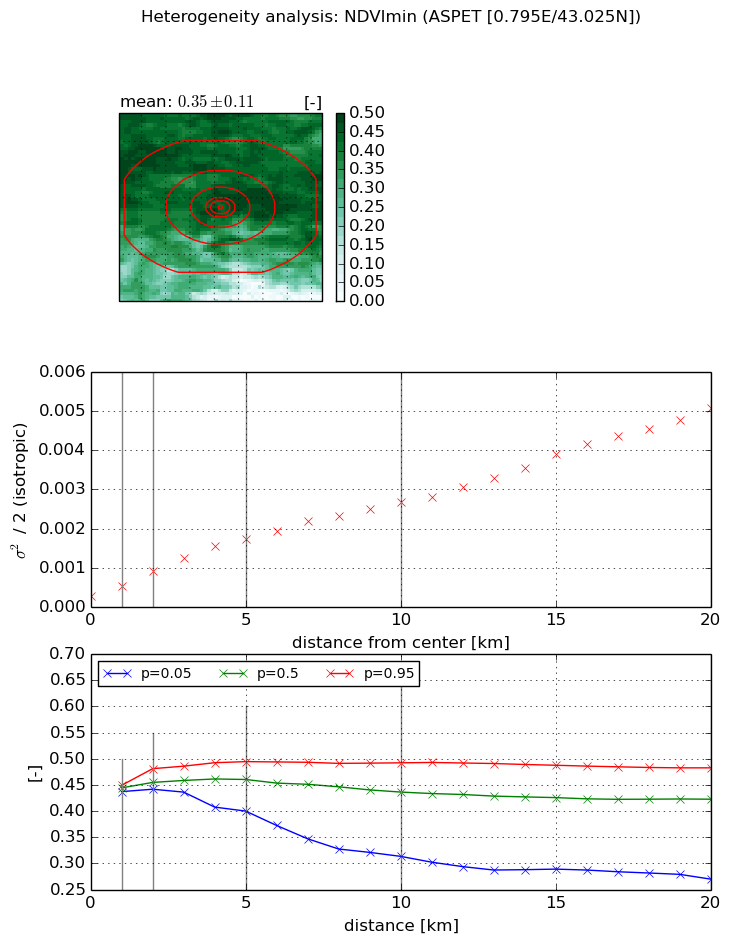
Heterogeneity analysis

The heterogeneity analysis provides information about the spatial and temporal heterogeneity of the site.

Topography


Roman et al. (2009) index


St

0.000906886108896

Rcv

0.588177817857

Rse

0.0

Rst

-0.0865420427834

Rsv

3307.34816259


Height range @ 1km [m]

105

Height range @ 2km [m]

212

Height range @ 5km [m]

379

Height range @ 10km [m]

-999

Height range @ 20km [m]

-999


Variance slope @ 1 km

5472

Variance slope @ 2 km

4741

Variance slope @ 5 km

2975

Variance slope @ 10 km

-999

Variance slope @ 20 km

-999


NDVI (max. NDVI composite)


Roman et al. (2009) index


St

0.836919893717

Rcv

0.688412234271

Rse

0.0

Rst

-2.21166791932e-09

Rsv

2.89616022084


NDVI range @ 1km [-]

0.02

NDVI range @ 2km [-]

0.03

NDVI range @ 5km [-]

0.1

NDVI range @ 10km [-]

0.14

NDVI range @ 20km [-]

0.16


Variance slope @ 1 km

0.000191603682147

Variance slope @ 2 km

0.00022550294366

Variance slope @ 5 km

0.000192832762709

Variance slope @ 10 km

0.00014010807882

Variance slope @ 20 km

0.000130989746945


NDVI (min. NDVI composite)I


Roman et al. (2009) index


St

nan

Rcv

nan

Rse

nan

Rst

nan

Rsv

nan


NDVI range @ 1km [-]

0.01

NDVI range @ 2km [-]

0.04

NDVI range @ 5km [-]

0.09

NDVI range @ 10km [-]

0.18

NDVI range @ 20km [-]

0.21


NDVI slope @ 1 km

0.000264472889262

NDVI slope @ 2 km

0.000322763659682

NDVI slope @ 5 km

0.000305887094917

NDVI slope @ 10 km

0.00023966549765

NDVI slope @ 20 km

0.000227240804866


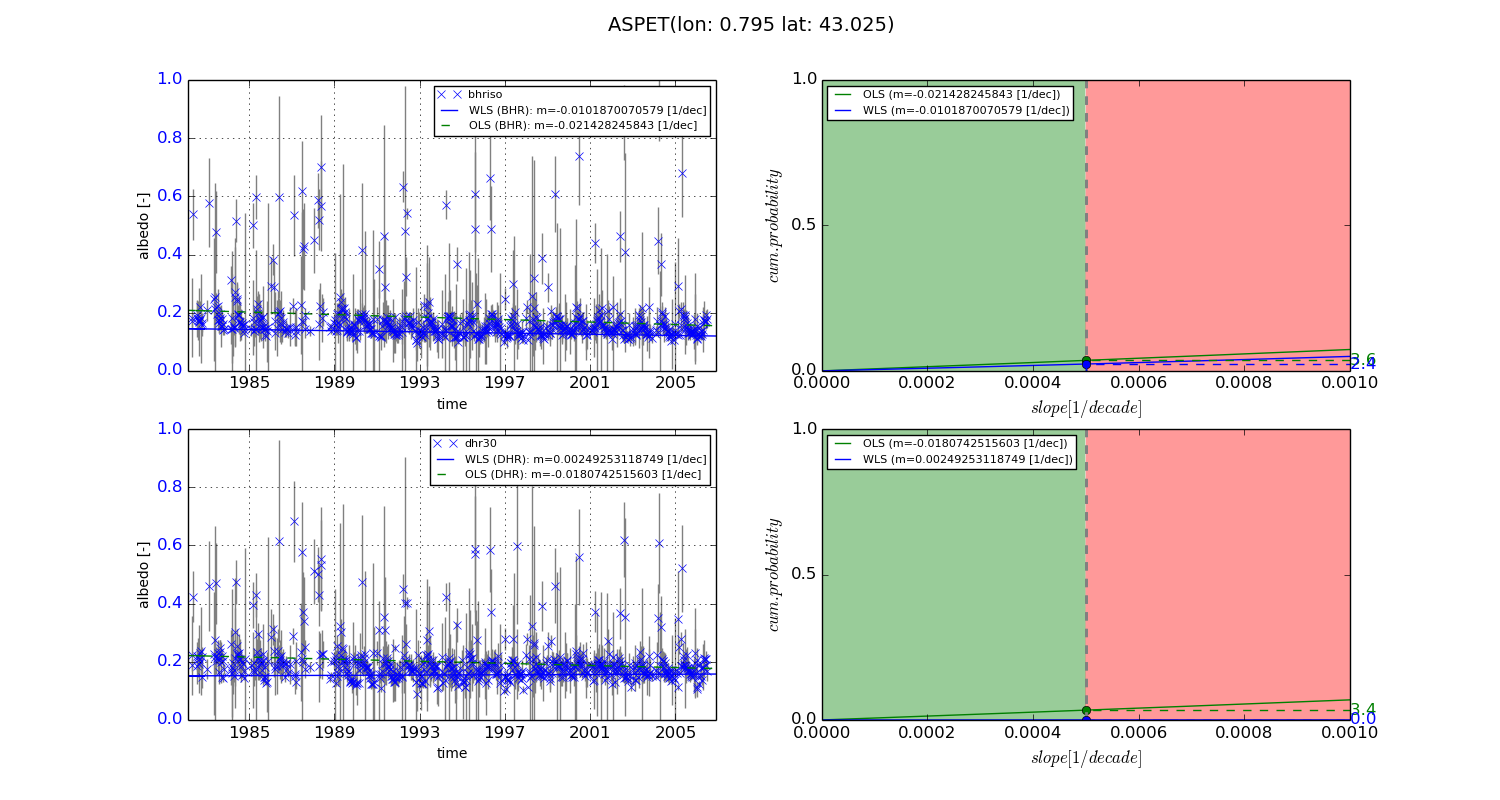
Temporal stability analysis

+000 deg (BHR)


BHR statistics

Temporal stability [1/decade]:


abs

rel


Weighted least square:

-0.0101870070579


Ordinary least square:

-0.021428245843


Probabilities that GCOS criteria is met:

Weighted least square:

2.4 %

Ordinary least square:

3.6 %


DHR statistics

Temporal stability [1/decade]:


abs

rel


Weighted least square:

0.00249253118749


Ordinary least square:

-0.0180742515603


Probabilities that GCOS criteria is met:

Weighted least square:

0.0 %

Ordinary least square:

3.4 %


+057/+063 deg (BHR)


BHR statistics

Temporal stability [1/decade]:


abs

rel


Weighted least square:

-99999.0


Ordinary least square:

-99999.0


Probabilities that GCOS criteria is met:

Weighted least square:

-99999.0 %

Ordinary least square:

-99999.0 %


DHR statistics

Temporal stability [1/decade]:


abs

rel


Weighted least square:

-99999.0


Ordinary least square:

-99999.0


Probabilities that GCOS criteria is met:

Weighted least square:

-99999.0 %

Ordinary least square:

-99999.0 %


Temporal anomaly analyis

The variance of the temporal anomalies provides an additional measure about the stability of the signal AFTER removal of the mean seasonal cylce.
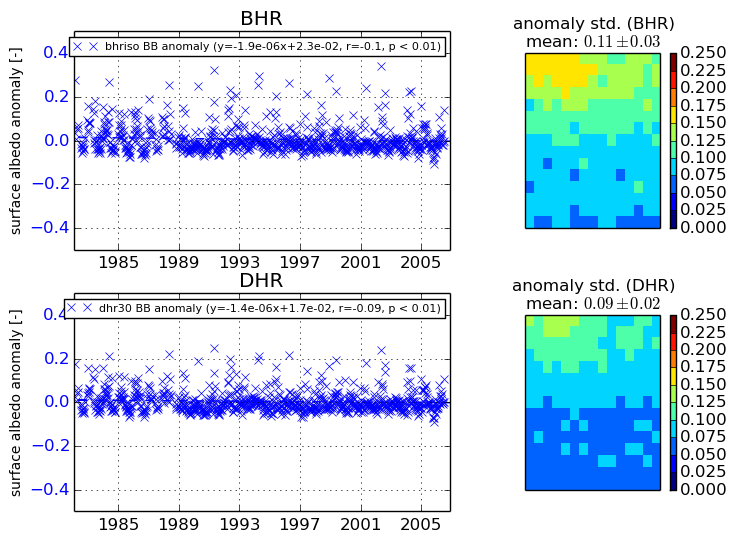
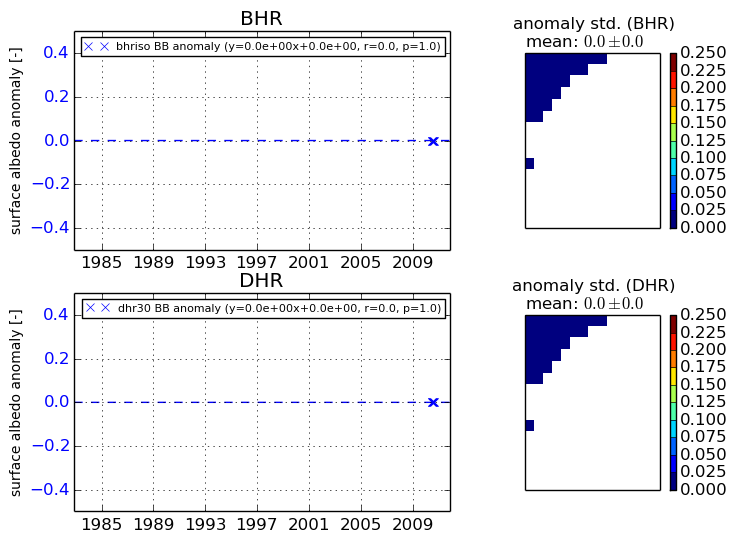
+000 deg


+057/+063 deg