ASP


Location

lon / lat [deg]: 133.888 / -23.798

Source network: BSRN


Geostationary surface albedo (GSA) data


“+000”


“+057/+063”


Landcover information (based on ESA CCI landcover data)


Landcover fractions @ 2km distance


Landcover fractions @ 20 km distance


Legend


Distance to open water bodies [km]:

7.3

Distance to urban areas [km]:

4.27


Radius: 1 km

Number of landcover classes:

2

Dominant landcover type:

130: grassland

Fraction of dominant landcover type [%]:

53.0


Radius: 2 km

Number of landcover classes:

4

Dominant landcover type:

150: Sparse vegetation (tree, shrub, herbaceous cover) (<15%)

Fraction of dominant landcover type [%]:

64.0


Radius: 5 km

Number of landcover classes:

5

Dominant landcover type:

150: Sparse vegetation (tree, shrub, herbaceous cover) (<15%)

Fraction of dominant landcover type [%]:

61.0


Radius: 10 km

Number of landcover classes:

4

Dominant landcover type:

150: Sparse vegetation (tree, shrub, herbaceous cover) (<15%)

Fraction of dominant landcover type [%]:

56.0


Radius: 20 km

Number of landcover classes:

4

Dominant landcover type:

150: Sparse vegetation (tree, shrub, herbaceous cover) (<15%)

Fraction of dominant landcover type [%]:

60.0


Disturbances


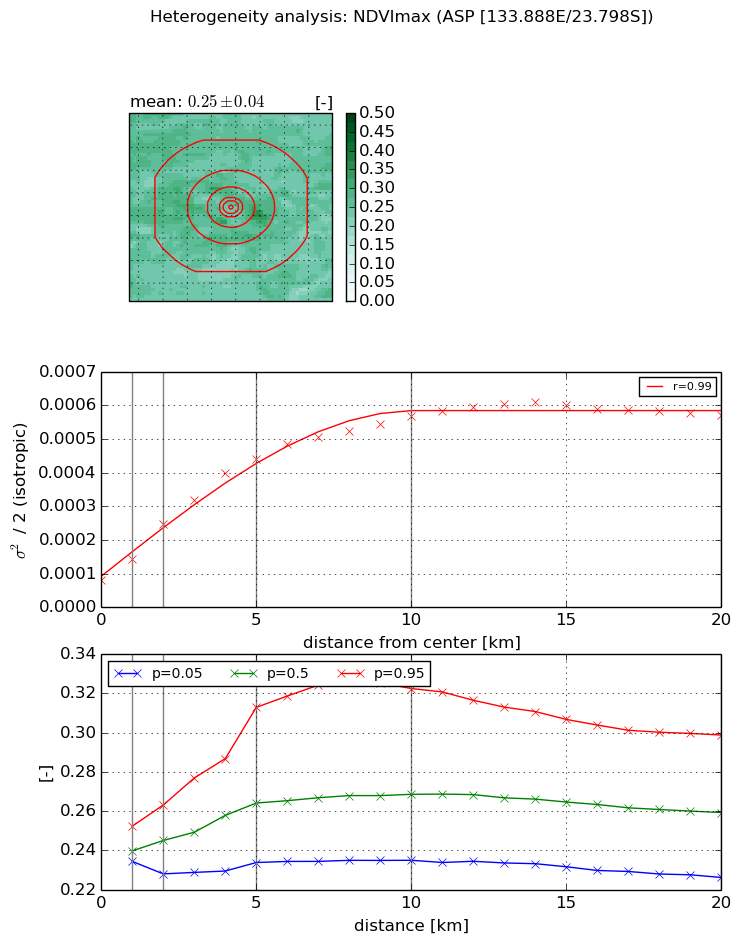
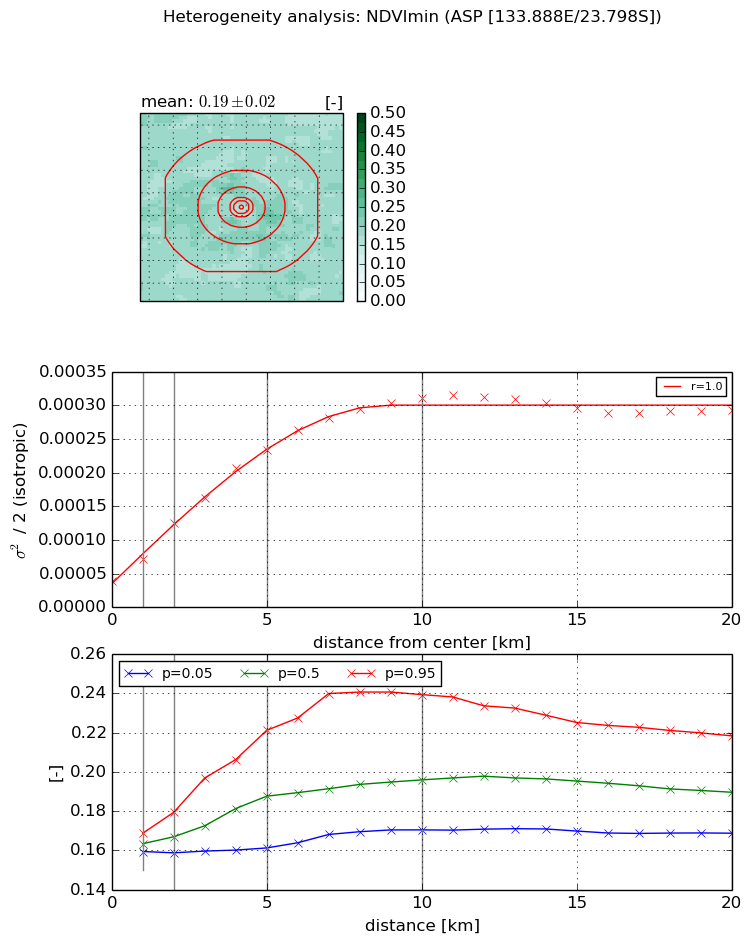
Heterogeneity analysis

The heterogeneity analysis provides information about the spatial and temporal heterogeneity of the site.

Topography


Roman et al. (2009) index


St

1.72653759463

Rcv

0.747704731977

Rse

0.0

Rst

-5.50974458144e-06

Rsv

-0.989871383682


Height range @ 1km [m]

5

Height range @ 2km [m]

8

Height range @ 5km [m]

19

Height range @ 10km [m]

-999

Height range @ 20km [m]

-999


Variance slope @ 1 km

16

Variance slope @ 2 km

9

Variance slope @ 5 km

10

Variance slope @ 10 km

-999

Variance slope @ 20 km

-999


NDVI (max. NDVI composite)


Roman et al. (2009) index


St

6.09990623659

Rcv

0.432232856921

Rse

0.0

Rst

-0.0554108175435

Rsv

0.00416716387362


NDVI range @ 1km [-]

0.02

NDVI range @ 2km [-]

0.04

NDVI range @ 5km [-]

0.08

NDVI range @ 10km [-]

0.09

NDVI range @ 20km [-]

0.07


Variance slope @ 1 km

6.43370843114e-05

Variance slope @ 2 km

8.43718845001e-05

Variance slope @ 5 km

7.5635516382e-05

Variance slope @ 10 km

4.84675273495e-05

Variance slope @ 20 km

2.1157731222e-05


NDVI (min. NDVI composite)I


Roman et al. (2009) index


St

4.07387920237

Rcv

0.45440515448

Rse

0.0

Rst

0.0739572230073

Rsv

-0.208036482413


NDVI range @ 1km [-]

0.01

NDVI range @ 2km [-]

0.02

NDVI range @ 5km [-]

0.06

NDVI range @ 10km [-]

0.07

NDVI range @ 20km [-]

0.05


NDVI slope @ 1 km

3.2247319801e-05

NDVI slope @ 2 km

4.29033553389e-05

NDVI slope @ 5 km

4.05559521927e-05

NDVI slope @ 10 km

2.81699640408e-05

NDVI slope @ 20 km

1.0181505982e-05


Temporal stability analysis

+000 deg (BHR)


BHR statistics

Temporal stability [1/decade]:


abs

rel


Weighted least square:

None


Ordinary least square:

None


Probabilities that GCOS criteria is met:

Weighted least square:

None %

Ordinary least square:

None %


DHR statistics

Temporal stability [1/decade]:


abs

rel


Weighted least square:

None


Ordinary least square:

None


Probabilities that GCOS criteria is met:

Weighted least square:

None %

Ordinary least square:

None %


+057/+063 deg (BHR)


BHR statistics

Temporal stability [1/decade]:


abs

rel


Weighted least square:

-99999.0


Ordinary least square:

-99999.0


Probabilities that GCOS criteria is met:

Weighted least square:

-99999.0 %

Ordinary least square:

-99999.0 %


DHR statistics

Temporal stability [1/decade]:


abs

rel


Weighted least square:

-99999.0


Ordinary least square:

-99999.0


Probabilities that GCOS criteria is met:

Weighted least square:

-99999.0 %

Ordinary least square:

-99999.0 %


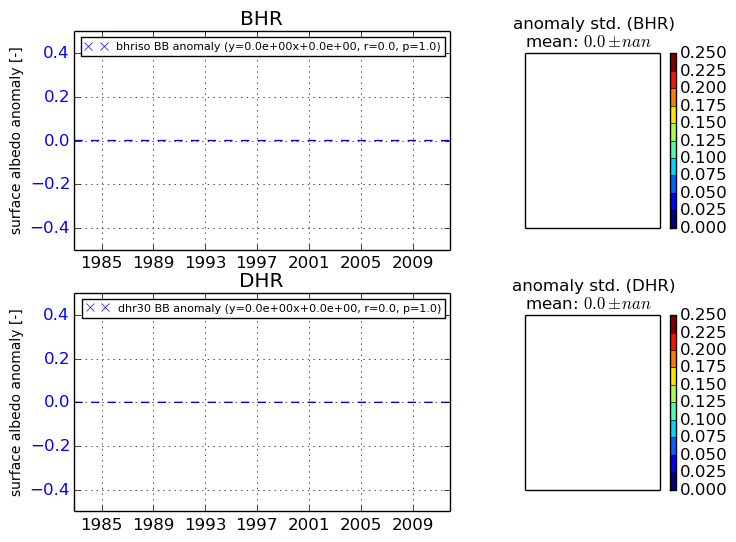
Temporal anomaly analyis

The variance of the temporal anomalies provides an additional measure about the stability of the signal AFTER removal of the mean seasonal cylce.

+000 deg


+057/+063 deg