AT-NEU


Location

lon / lat [deg]: 11.3175 / 47.1167

Source network: FLUXNET


Geostationary surface albedo (GSA) data


“+000”


“+057/+063”


Landcover information (based on ESA CCI landcover data)


Landcover fractions @ 2km distance


Landcover fractions @ 20 km distance


Legend


Distance to open water bodies [km]:

3.5

Distance to urban areas [km]:

0.23


Radius: 1 km

Number of landcover classes:

4

Dominant landcover type:

70: Tree cover, needleleaved, evergreen, closed to open (>15%)

Fraction of dominant landcover type [%]:

38.0


Radius: 2 km

Number of landcover classes:

6

Dominant landcover type:

70: Tree cover, needleleaved, evergreen, closed to open (>15%)

Fraction of dominant landcover type [%]:

51.0


Radius: 5 km

Number of landcover classes:

10

Dominant landcover type:

70: Tree cover, needleleaved, evergreen, closed to open (>15%)

Fraction of dominant landcover type [%]:

52.0


Radius: 10 km

Number of landcover classes:

9

Dominant landcover type:

70: Tree cover, needleleaved, evergreen, closed to open (>15%)

Fraction of dominant landcover type [%]:

52.0


Radius: 20 km

Number of landcover classes:

10

Dominant landcover type:

70: Tree cover, needleleaved, evergreen, closed to open (>15%)

Fraction of dominant landcover type [%]:

43.0


Disturbances


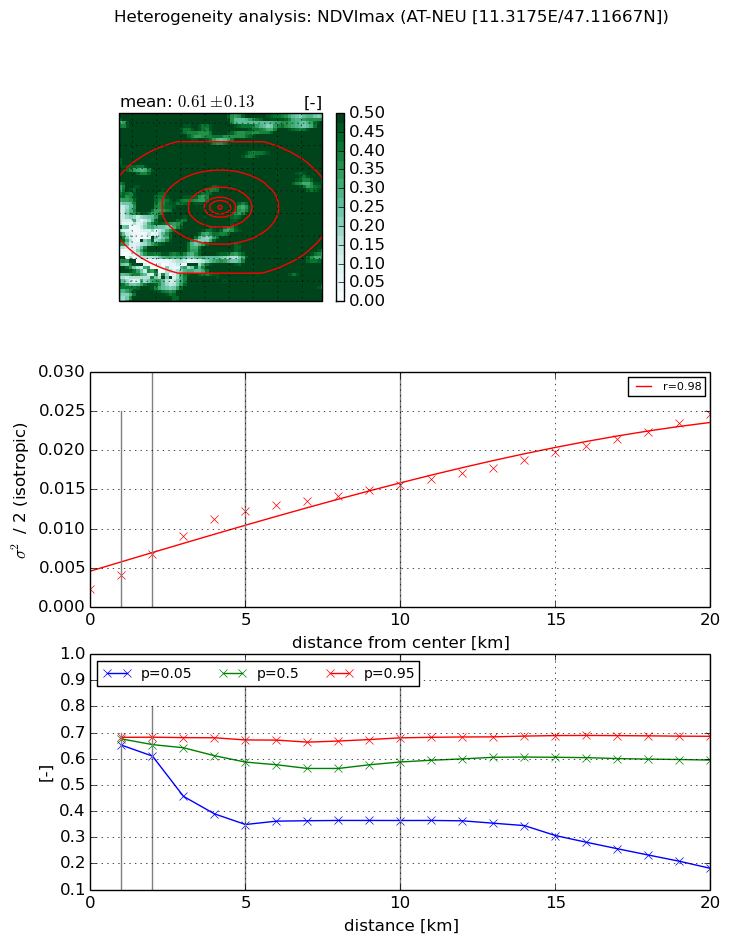
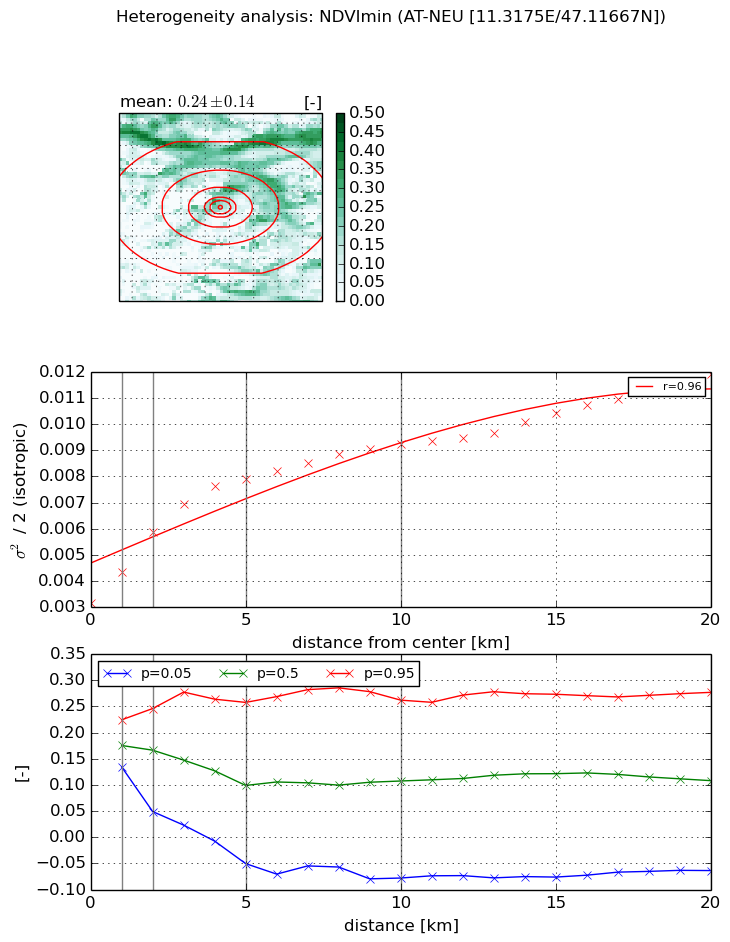
Heterogeneity analysis

The heterogeneity analysis provides information about the spatial and temporal heterogeneity of the site.

Topography


Roman et al. (2009) index


St

3.49837210778

Rcv

0.0972104579925

Rse

0.0

Rst

-0.0427795773591

Rsv

0.717551674785


Height range @ 1km [m]

397

Height range @ 2km [m]

778

Height range @ 5km [m]

1443

Height range @ 10km [m]

-999

Height range @ 20km [m]

-999


Variance slope @ 1 km

55762

Variance slope @ 2 km

70359

Variance slope @ 5 km

61577

Variance slope @ 10 km

-999

Variance slope @ 20 km

-999


NDVI (max. NDVI composite)


Roman et al. (2009) index


St

3.68541619403

Rcv

0.741071876135

Rse

0.0

Rst

-0.0718977709264

Rsv

0.0010496772317


NDVI range @ 1km [-]

0.03

NDVI range @ 2km [-]

0.07

NDVI range @ 5km [-]

0.32

NDVI range @ 10km [-]

0.32

NDVI range @ 20km [-]

0.51


Variance slope @ 1 km

0.00175599057638

Variance slope @ 2 km

0.00224141052117

Variance slope @ 5 km

0.00208839497689

Variance slope @ 10 km

0.00129225782366

Variance slope @ 20 km

0.000967842934065


NDVI (min. NDVI composite)I


Roman et al. (2009) index


St

1.3409731259e-06

Rcv

0.563229862327

Rse

0.0

Rst

0.0943043551444

Rsv

2237180.64168


NDVI range @ 1km [-]

0.09

NDVI range @ 2km [-]

0.2

NDVI range @ 5km [-]

0.31

NDVI range @ 10km [-]

0.34

NDVI range @ 20km [-]

0.34


NDVI slope @ 1 km

0.00118761861422

NDVI slope @ 2 km

0.0013618038133

NDVI slope @ 5 km

0.000989033738002

NDVI slope @ 10 km

0.000562166733937

NDVI slope @ 20 km

0.00034767787901


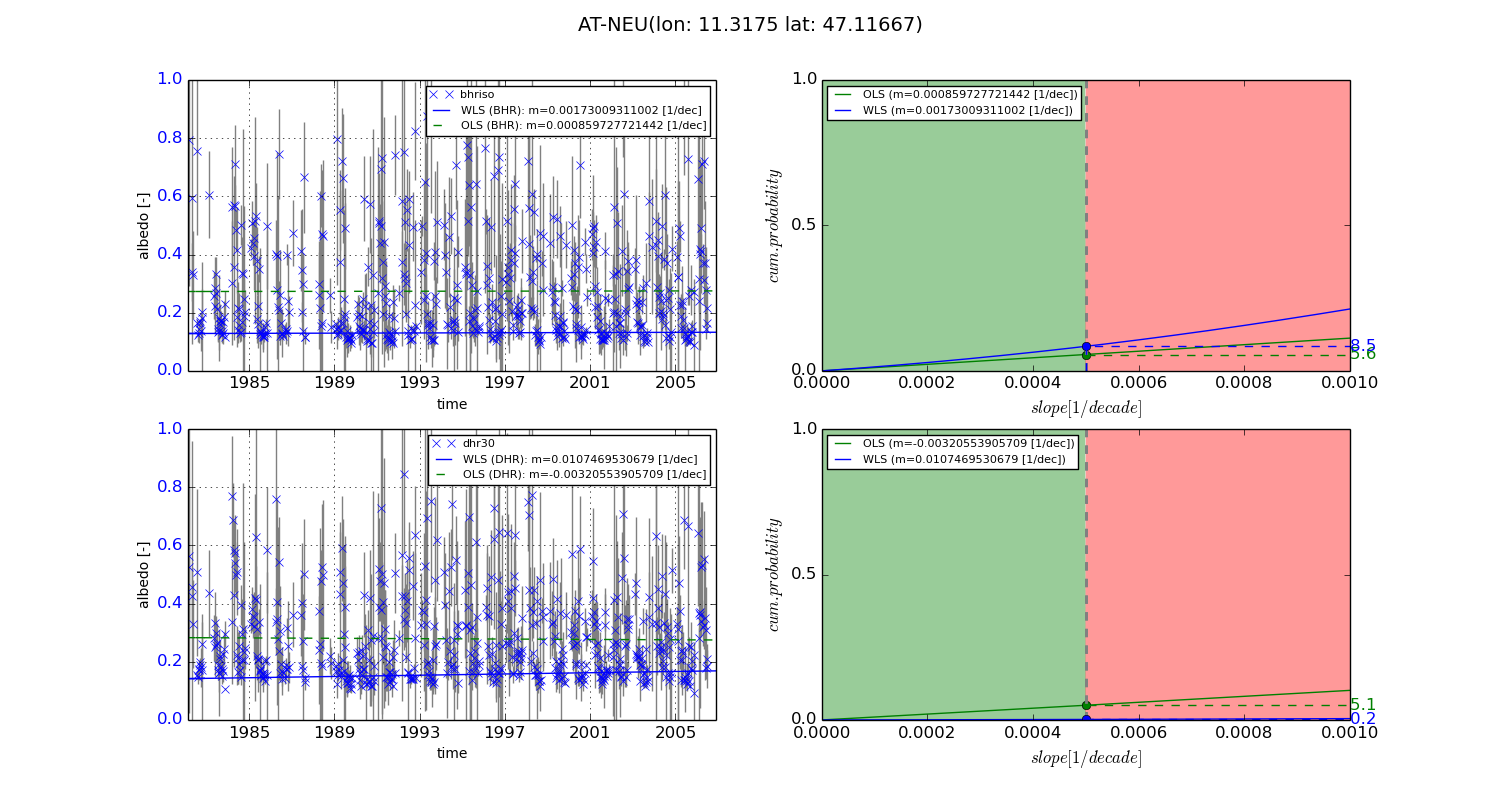
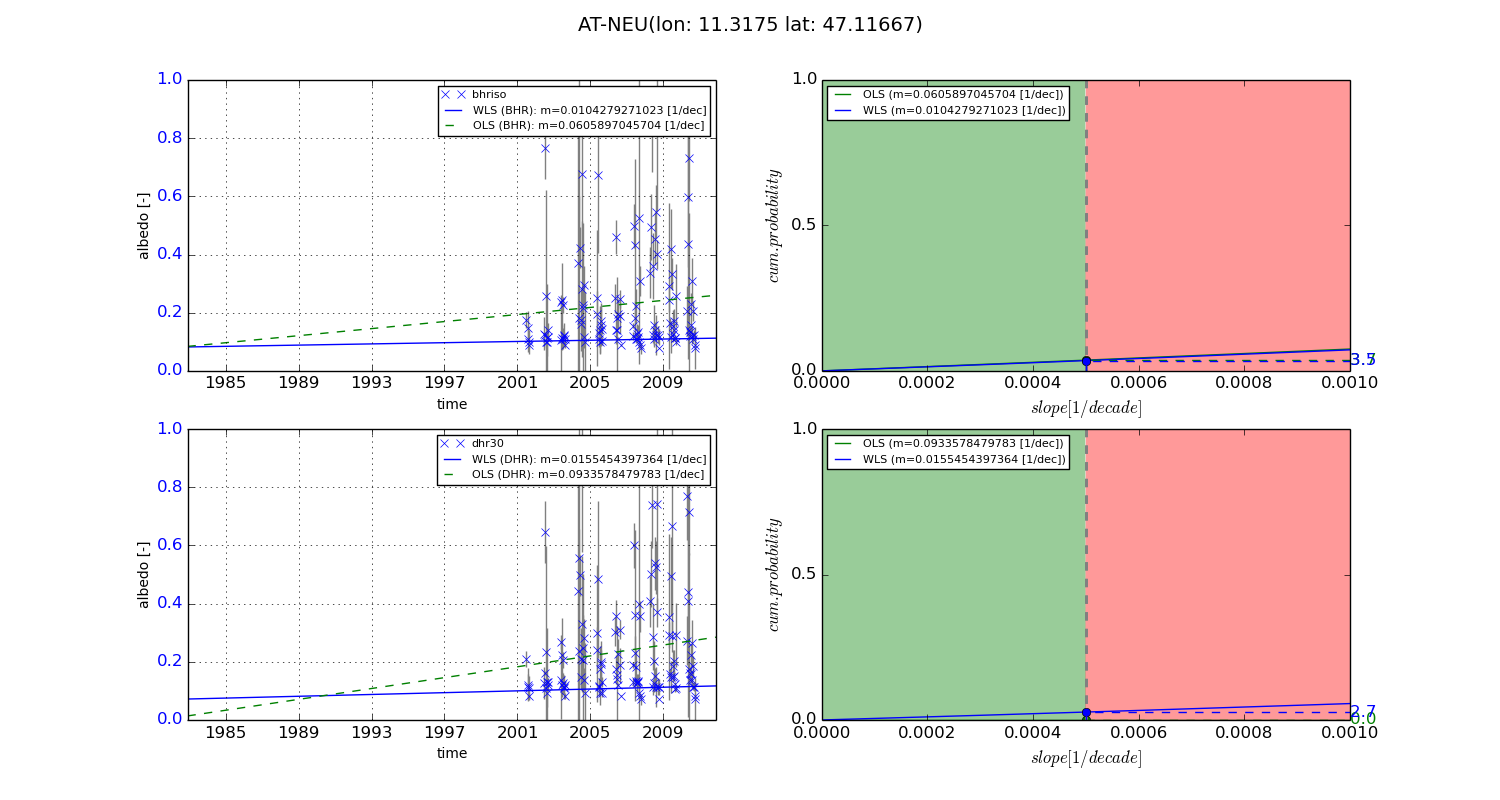
Temporal stability analysis

+000 deg (BHR)


BHR statistics

Temporal stability [1/decade]:


abs

rel


Weighted least square:

0.00173009311002


Ordinary least square:

0.000859727721442


Probabilities that GCOS criteria is met:

Weighted least square:

8.5 %

Ordinary least square:

5.6 %


DHR statistics

Temporal stability [1/decade]:


abs

rel


Weighted least square:

0.0107469530679


Ordinary least square:

-0.00320553905709


Probabilities that GCOS criteria is met:

Weighted least square:

0.2 %

Ordinary least square:

5.1 %


+057/+063 deg (BHR)


BHR statistics

Temporal stability [1/decade]:


abs

rel


Weighted least square:

0.0104279271023


Ordinary least square:

0.0605897045704


Probabilities that GCOS criteria is met:

Weighted least square:

3.5 %

Ordinary least square:

3.7 %


DHR statistics

Temporal stability [1/decade]:


abs

rel


Weighted least square:

0.0155454397364


Ordinary least square:

0.0933578479783


Probabilities that GCOS criteria is met:

Weighted least square:

2.7 %

Ordinary least square:

0.0 %


Temporal anomaly analyis

The variance of the temporal anomalies provides an additional measure about the stability of the signal AFTER removal of the mean seasonal cylce.
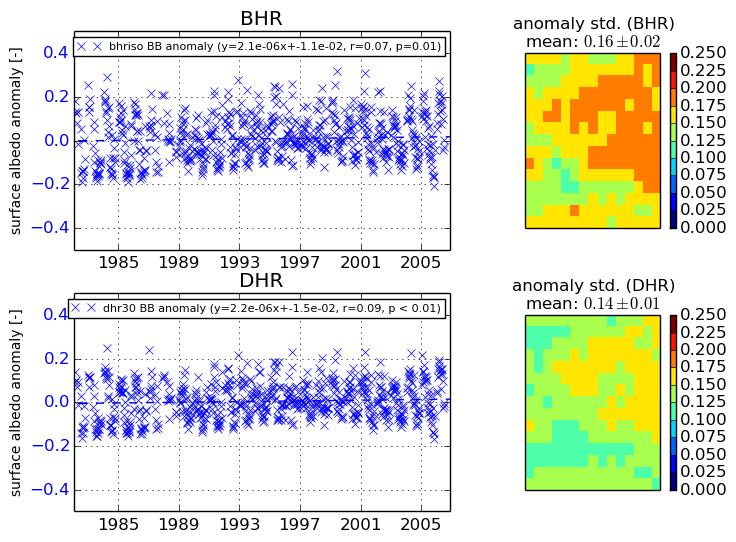
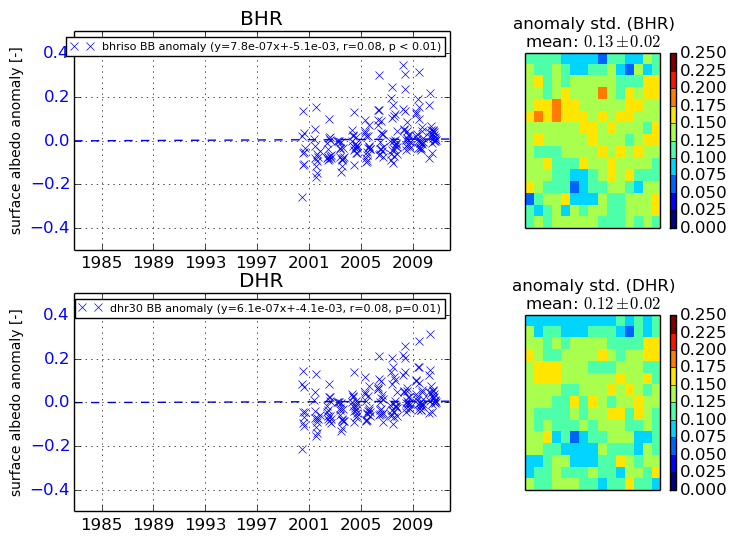
+000 deg


+057/+063 deg