AU-TUM


Location

lon / lat [deg]: 148.152 / -35.6557

Source network: FLUXNET


Geostationary surface albedo (GSA) data


“+000”


“+057/+063”


Landcover information (based on ESA CCI landcover data)


Landcover fractions @ 2km distance


Landcover fractions @ 20 km distance


Legend


Distance to open water bodies [km]:

12.93

Distance to urban areas [km]:

37.78


Radius: 1 km

Number of landcover classes:

1

Dominant landcover type:

50: Tree cover, broadleaved, evergreen, closed to open (>15%)

Fraction of dominant landcover type [%]:

100.0


Radius: 2 km

Number of landcover classes:

1

Dominant landcover type:

50: Tree cover, broadleaved, evergreen, closed to open (>15%)

Fraction of dominant landcover type [%]:

100.0


Radius: 5 km

Number of landcover classes:

2

Dominant landcover type:

50: Tree cover, broadleaved, evergreen, closed to open (>15%)

Fraction of dominant landcover type [%]:

99.0


Radius: 10 km

Number of landcover classes:

2

Dominant landcover type:

50: Tree cover, broadleaved, evergreen, closed to open (>15%)

Fraction of dominant landcover type [%]:

96.0


Radius: 20 km

Number of landcover classes:

7

Dominant landcover type:

50: Tree cover, broadleaved, evergreen, closed to open (>15%)

Fraction of dominant landcover type [%]:

71.0


Disturbances


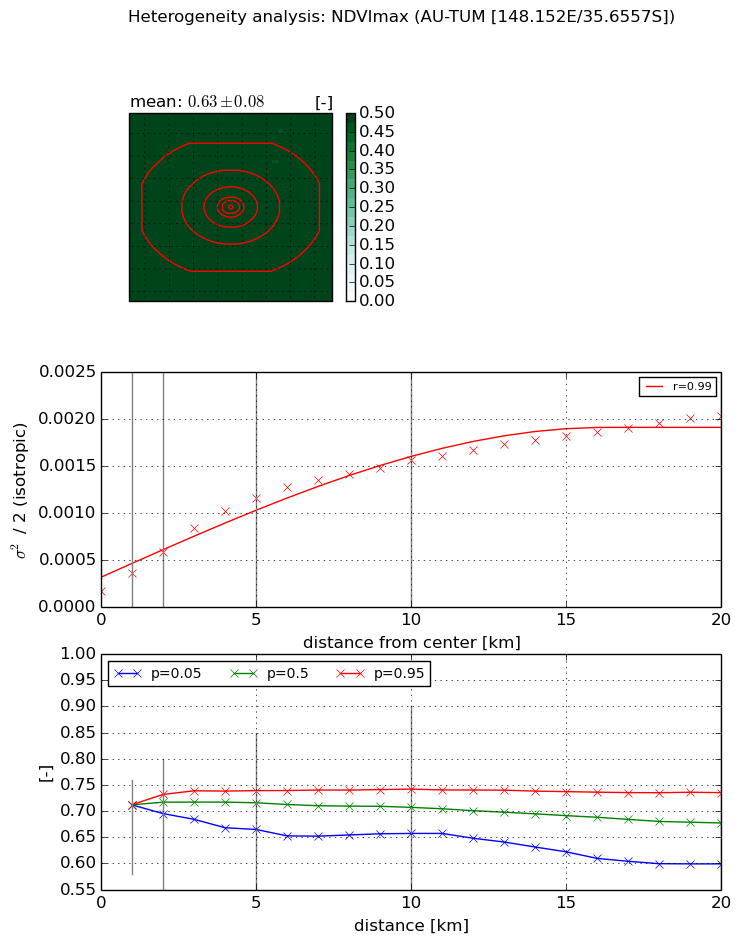
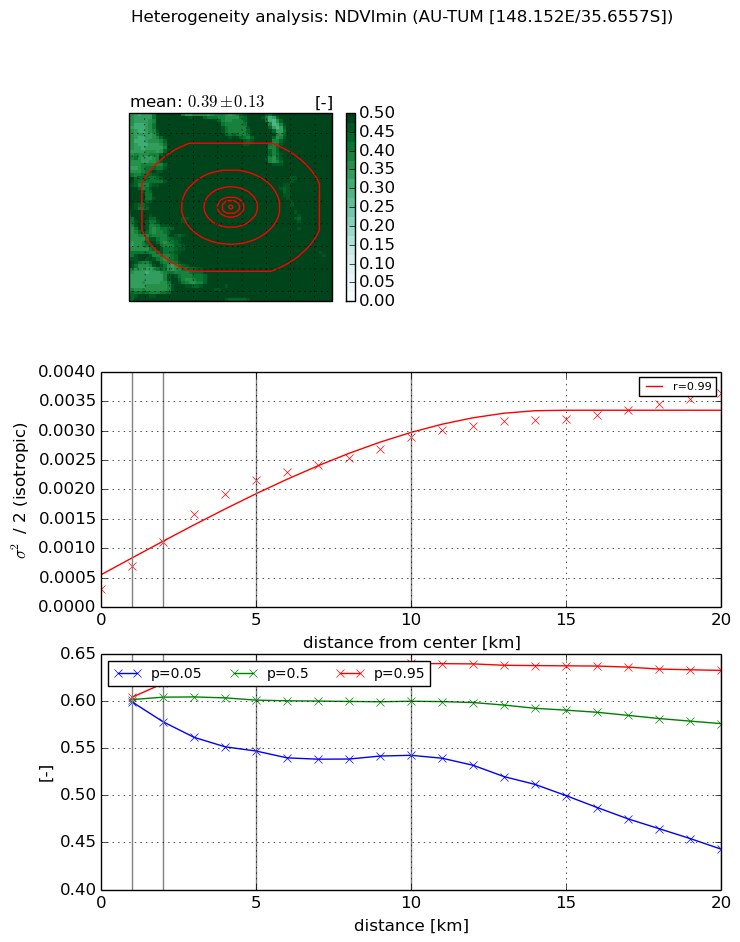
Heterogeneity analysis

The heterogeneity analysis provides information about the spatial and temporal heterogeneity of the site.

Topography


Roman et al. (2009) index


St

1.71876819698

Rcv

0.657622164335

Rse

0.0

Rst

-0.0137405656997

Rsv

1.0740733359


Height range @ 1km [m]

79

Height range @ 2km [m]

100

Height range @ 5km [m]

217

Height range @ 10km [m]

-999

Height range @ 20km [m]

-999


Variance slope @ 1 km

1284

Variance slope @ 2 km

1515

Variance slope @ 5 km

1648

Variance slope @ 10 km

-999

Variance slope @ 20 km

-999


NDVI (max. NDVI composite)


Roman et al. (2009) index


St

2.39086850754

Rcv

0.403355402197

Rse

0.0

Rst

0.139680951269

Rsv

0.711737796822


NDVI range @ 1km [-]

0.0

NDVI range @ 2km [-]

0.04

NDVI range @ 5km [-]

0.07

NDVI range @ 10km [-]

0.08

NDVI range @ 20km [-]

0.14


Variance slope @ 1 km

0.000197302856464

Variance slope @ 2 km

0.000206291824968

Variance slope @ 5 km

0.000205556899473

Variance slope @ 10 km

0.000138549273325

Variance slope @ 20 km

8.30696476881e-05


NDVI (min. NDVI composite)I


Roman et al. (2009) index


St

5.52558432852

Rcv

0.262632381184

Rse

0.0

Rst

-0.0364454617943

Rsv

0.243851161746


NDVI range @ 1km [-]

0.01

NDVI range @ 2km [-]

0.04

NDVI range @ 5km [-]

0.08

NDVI range @ 10km [-]

0.1

NDVI range @ 20km [-]

0.19


NDVI slope @ 1 km

0.000391491238174

NDVI slope @ 2 km

0.00039859582381

NDVI slope @ 5 km

0.000384301732863

NDVI slope @ 10 km

0.000247996085229

NDVI slope @ 20 km

0.000143736122287


Temporal stability analysis

+000 deg (BHR)


BHR statistics

Temporal stability [1/decade]:


abs

rel


Weighted least square:

None


Ordinary least square:

None


Probabilities that GCOS criteria is met:

Weighted least square:

None %

Ordinary least square:

None %


DHR statistics

Temporal stability [1/decade]:


abs

rel


Weighted least square:

None


Ordinary least square:

None


Probabilities that GCOS criteria is met:

Weighted least square:

None %

Ordinary least square:

None %


+057/+063 deg (BHR)


BHR statistics

Temporal stability [1/decade]:


abs

rel


Weighted least square:

None


Ordinary least square:

None


Probabilities that GCOS criteria is met:

Weighted least square:

None %

Ordinary least square:

None %


DHR statistics

Temporal stability [1/decade]:


abs

rel


Weighted least square:

None


Ordinary least square:

None


Probabilities that GCOS criteria is met:

Weighted least square:

None %

Ordinary least square:

None %


Temporal anomaly analyis

The variance of the temporal anomalies provides an additional measure about the stability of the signal AFTER removal of the mean seasonal cylce.

+000 deg


+057/+063 deg