AVIGNON


Location

lon / lat [deg]: 4.8781 / 43.9328

Source network: AERONET


Geostationary surface albedo (GSA) data


“+000”


“+057/+063”


Landcover information (based on ESA CCI landcover data)


Landcover fractions @ 2km distance


Landcover fractions @ 20 km distance


Legend


Distance to open water bodies [km]:

3.44

Distance to urban areas [km]:

0.13


Radius: 1 km

Number of landcover classes:

3

Dominant landcover type:

190: urban areas

Fraction of dominant landcover type [%]:

91.0


Radius: 2 km

Number of landcover classes:

3

Dominant landcover type:

190: urban areas

Fraction of dominant landcover type [%]:

75.0


Radius: 5 km

Number of landcover classes:

5

Dominant landcover type:

190: urban areas

Fraction of dominant landcover type [%]:

77.0


Radius: 10 km

Number of landcover classes:

5

Dominant landcover type:

190: urban areas

Fraction of dominant landcover type [%]:

53.0


Radius: 20 km

Number of landcover classes:

8

Dominant landcover type:

10: cropland, rainfed

Fraction of dominant landcover type [%]:

41.0


Disturbances


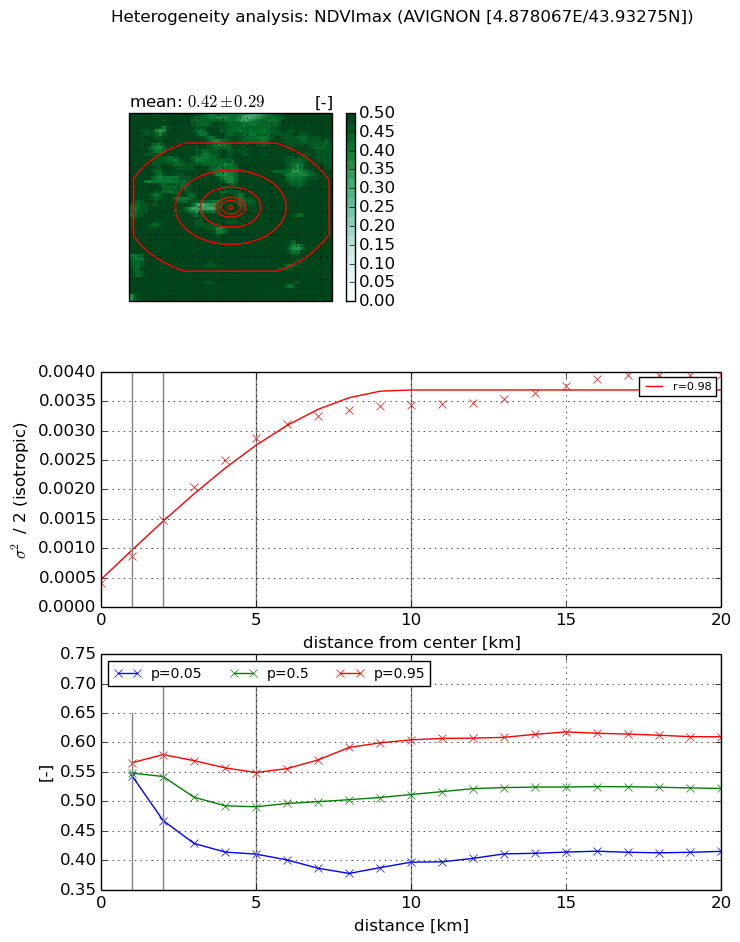
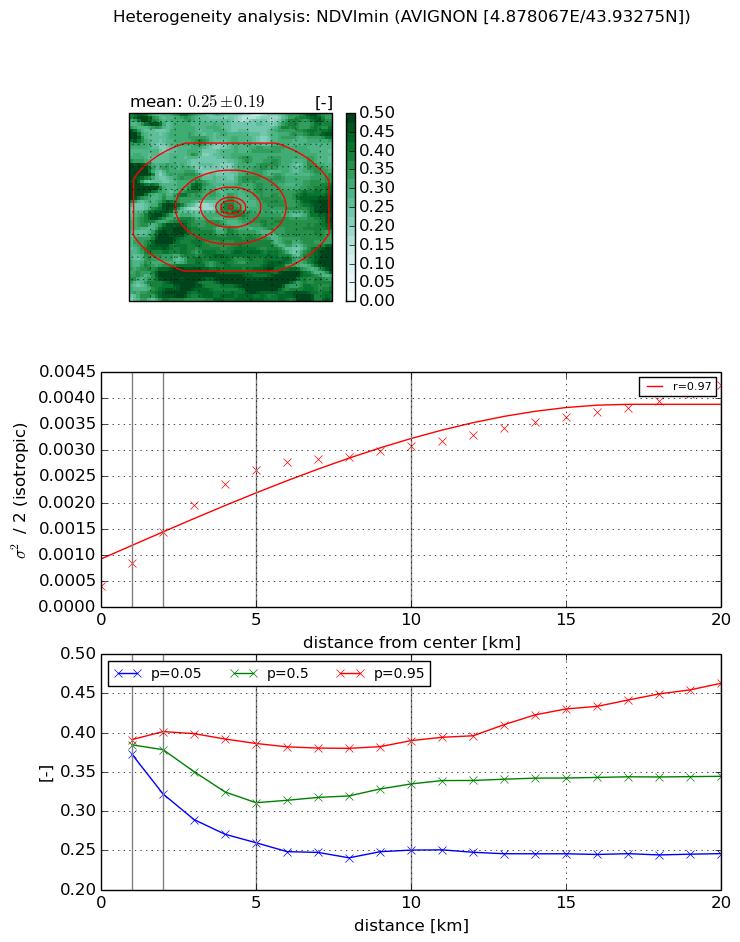
Heterogeneity analysis

The heterogeneity analysis provides information about the spatial and temporal heterogeneity of the site.

Topography


Roman et al. (2009) index


St

7.05536108312e-09

Rcv

1.97390062375

Rse

0.0

Rst

9.66558476367e-07

Rsv

425208568.453


Height range @ 1km [m]

7

Height range @ 2km [m]

10

Height range @ 5km [m]

83

Height range @ 10km [m]

-999

Height range @ 20km [m]

-999


Variance slope @ 1 km

150

Variance slope @ 2 km

139

Variance slope @ 5 km

96

Variance slope @ 10 km

-999

Variance slope @ 20 km

-999


NDVI (max. NDVI composite)


Roman et al. (2009) index


St

2.84492309955

Rcv

0.176986613787

Rse

0.0

Rst

-0.315549797339

Rsv

0.561973638889


NDVI range @ 1km [-]

0.02

NDVI range @ 2km [-]

0.11

NDVI range @ 5km [-]

0.14

NDVI range @ 10km [-]

0.21

NDVI range @ 20km [-]

0.19


Variance slope @ 1 km

0.000451897388347

Variance slope @ 2 km

0.000538818887611

Variance slope @ 5 km

0.000507404175508

Variance slope @ 10 km

0.000308273674808

Variance slope @ 20 km

0.000145655406123


NDVI (min. NDVI composite)I


Roman et al. (2009) index


St

2.87883068081

Rcv

0.247627240331

Rse

0.0

Rst

0.619611735241

Rsv

0.174850793722


NDVI range @ 1km [-]

0.02

NDVI range @ 2km [-]

0.08

NDVI range @ 5km [-]

0.13

NDVI range @ 10km [-]

0.14

NDVI range @ 20km [-]

0.22


NDVI slope @ 1 km

0.000438332985825

NDVI slope @ 2 km

0.000518867451729

NDVI slope @ 5 km

0.000461328044634

NDVI slope @ 10 km

0.000259010047968

NDVI slope @ 20 km

0.000155704152974


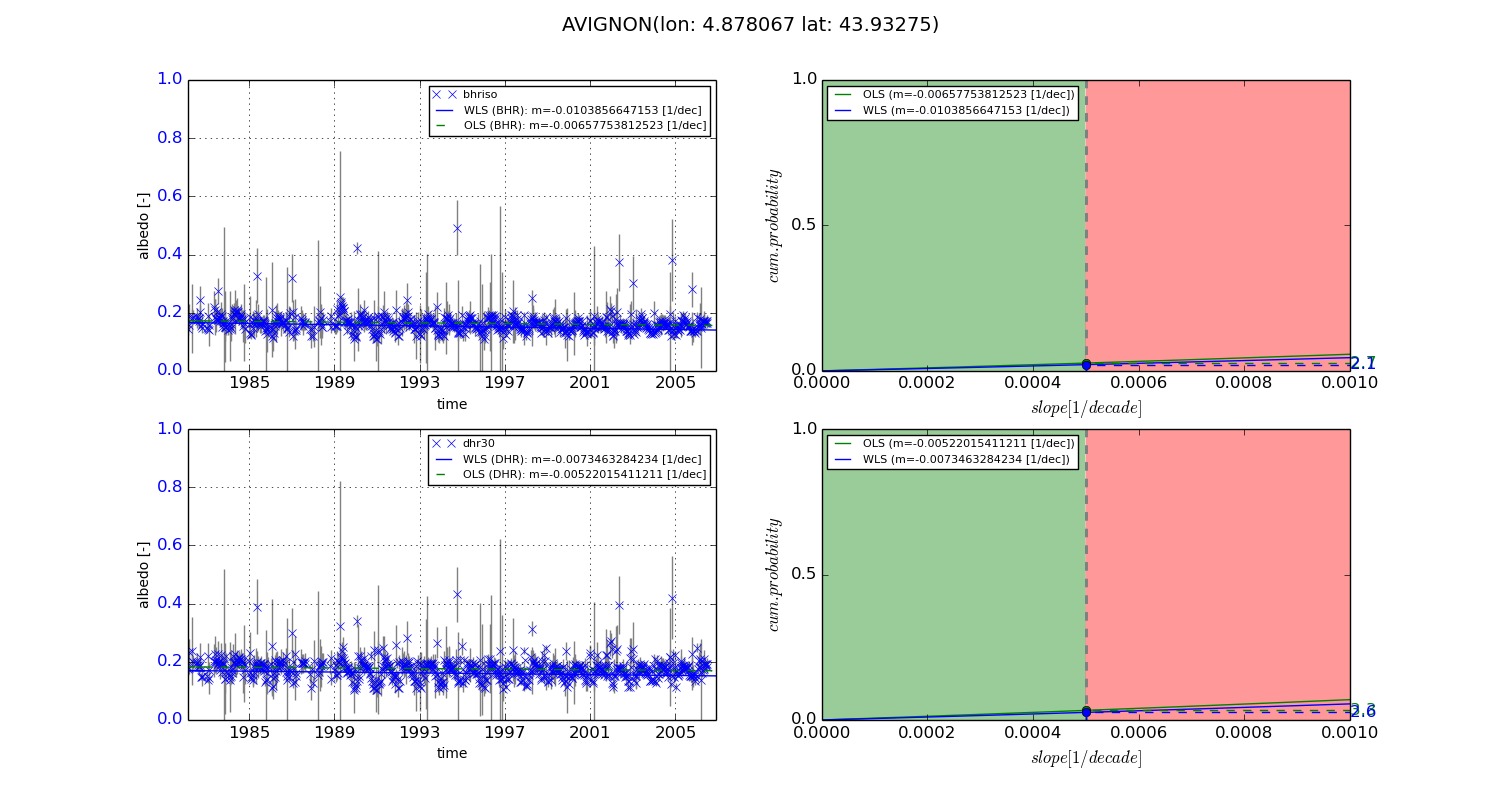
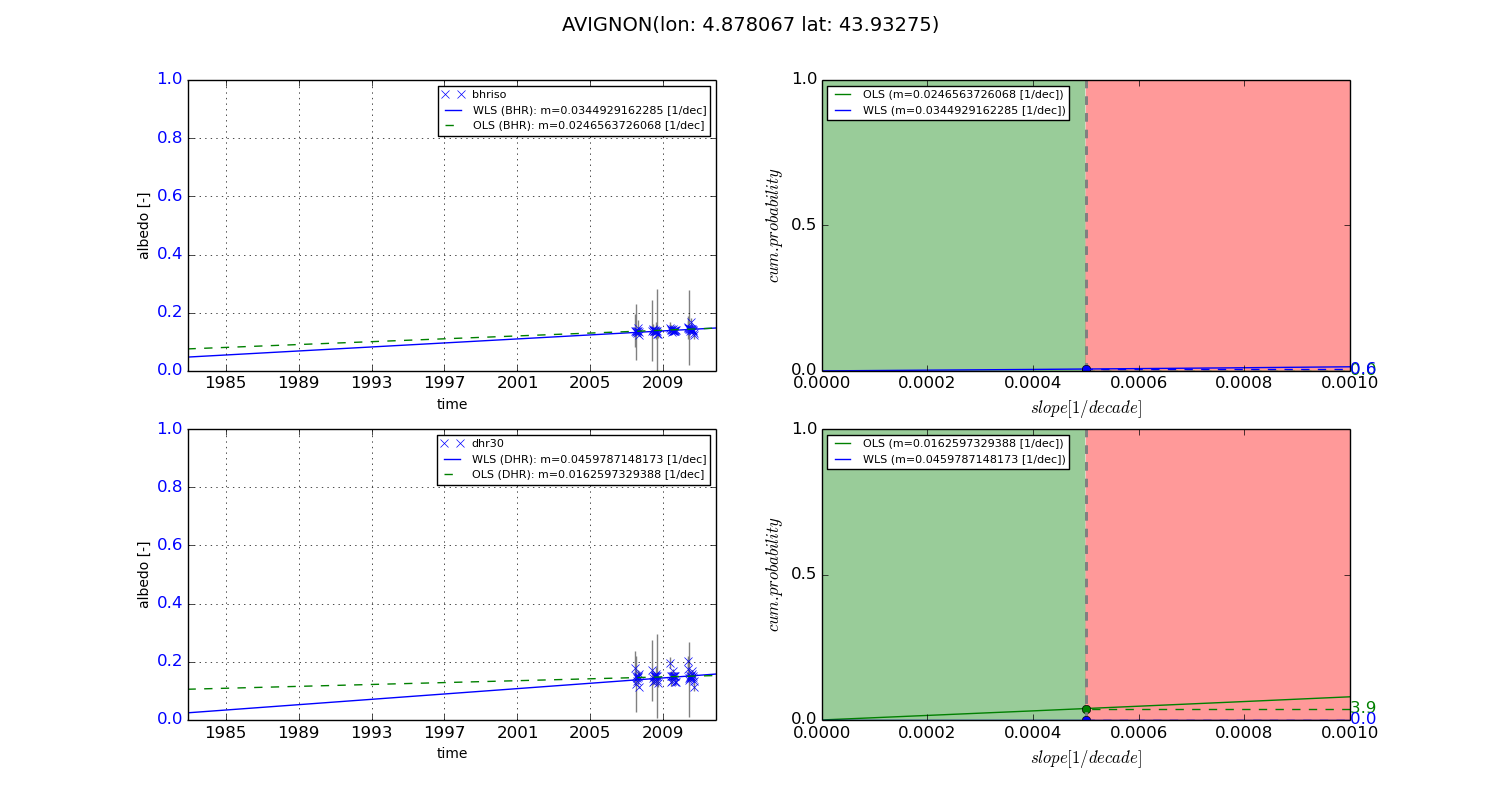
Temporal stability analysis

+000 deg (BHR)


BHR statistics

Temporal stability [1/decade]:


abs

rel


Weighted least square:

-0.0103856647153


Ordinary least square:

-0.00657753812523


Probabilities that GCOS criteria is met:

Weighted least square:

2.1 %

Ordinary least square:

2.7 %


DHR statistics

Temporal stability [1/decade]:


abs

rel


Weighted least square:

-0.0073463284234


Ordinary least square:

-0.00522015411211


Probabilities that GCOS criteria is met:

Weighted least square:

2.6 %

Ordinary least square:

3.3 %


+057/+063 deg (BHR)


BHR statistics

Temporal stability [1/decade]:


abs

rel


Weighted least square:

0.0344929162285


Ordinary least square:

0.0246563726068


Probabilities that GCOS criteria is met:

Weighted least square:

0.6 %

Ordinary least square:

0.0 %


DHR statistics

Temporal stability [1/decade]:


abs

rel


Weighted least square:

0.0459787148173


Ordinary least square:

0.0162597329388


Probabilities that GCOS criteria is met:

Weighted least square:

0.0 %

Ordinary least square:

3.9 %


Temporal anomaly analyis

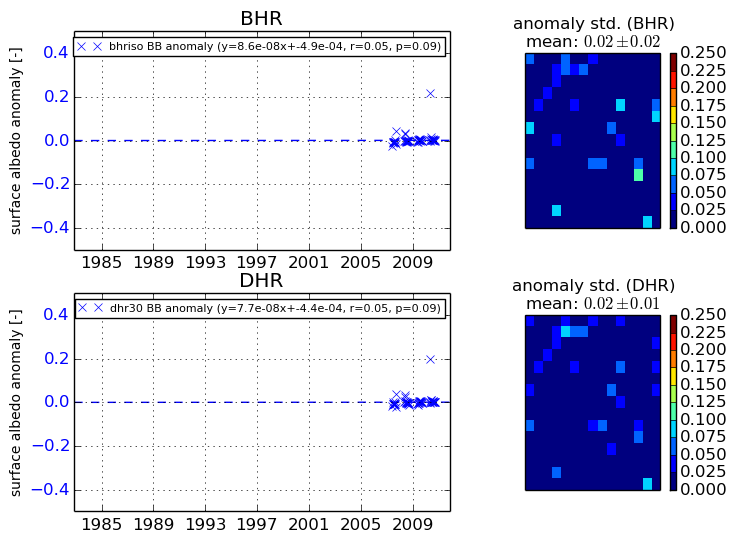
The variance of the temporal anomalies provides an additional measure about the stability of the signal AFTER removal of the mean seasonal cylce.
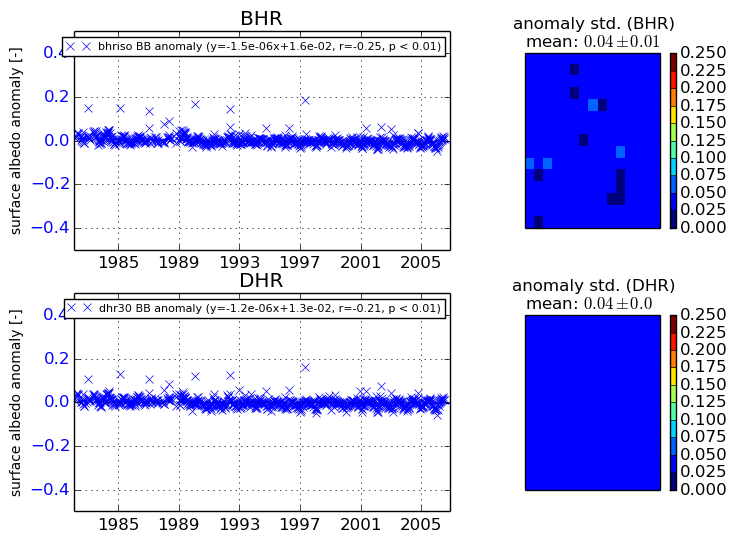
+000 deg


+057/+063 deg