BACKGARDEN_GZ


Location

lon / lat [deg]: 113.021 / 23.296

Source network: AERONET


Geostationary surface albedo (GSA) data


“+000”


“+057/+063”


Landcover information (based on ESA CCI landcover data)


Landcover fractions @ 2km distance


Landcover fractions @ 20 km distance


Legend


Distance to open water bodies [km]:

1.29

Distance to urban areas [km]:

1.55


Radius: 1 km

Number of landcover classes:

3

Dominant landcover type:

10: cropland, rainfed

Fraction of dominant landcover type [%]:

65.0


Radius: 2 km

Number of landcover classes:

7

Dominant landcover type:

10: cropland, rainfed

Fraction of dominant landcover type [%]:

66.0


Radius: 5 km

Number of landcover classes:

9

Dominant landcover type:

10: cropland, rainfed

Fraction of dominant landcover type [%]:

65.0


Radius: 10 km

Number of landcover classes:

10

Dominant landcover type:

10: cropland, rainfed

Fraction of dominant landcover type [%]:

54.0


Radius: 20 km

Number of landcover classes:

11

Dominant landcover type:

10: cropland, rainfed

Fraction of dominant landcover type [%]:

44.0


Disturbances


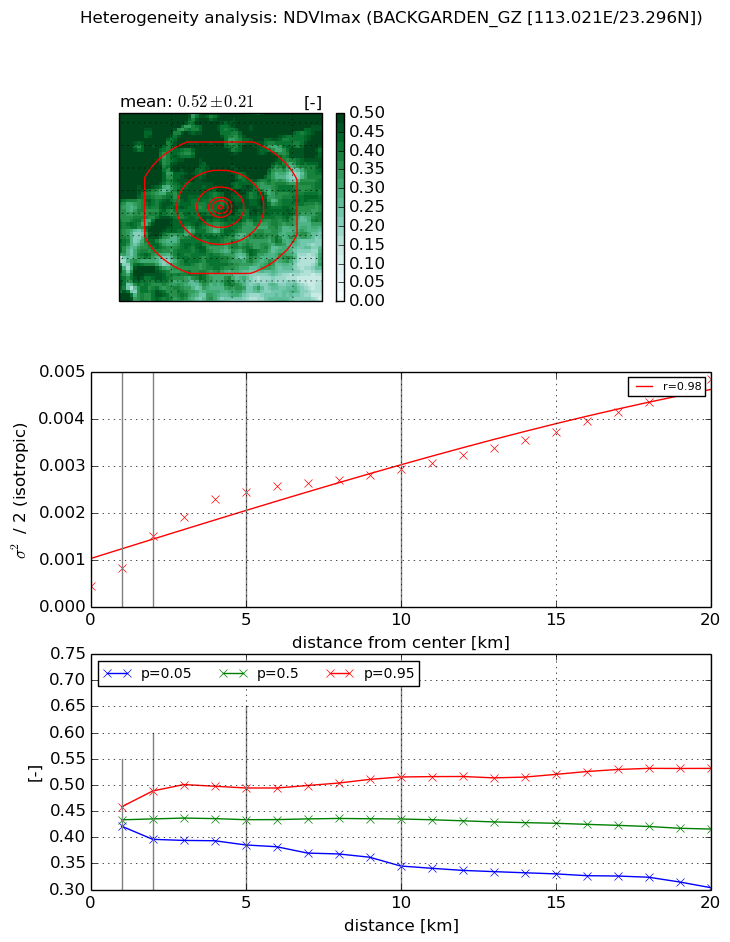
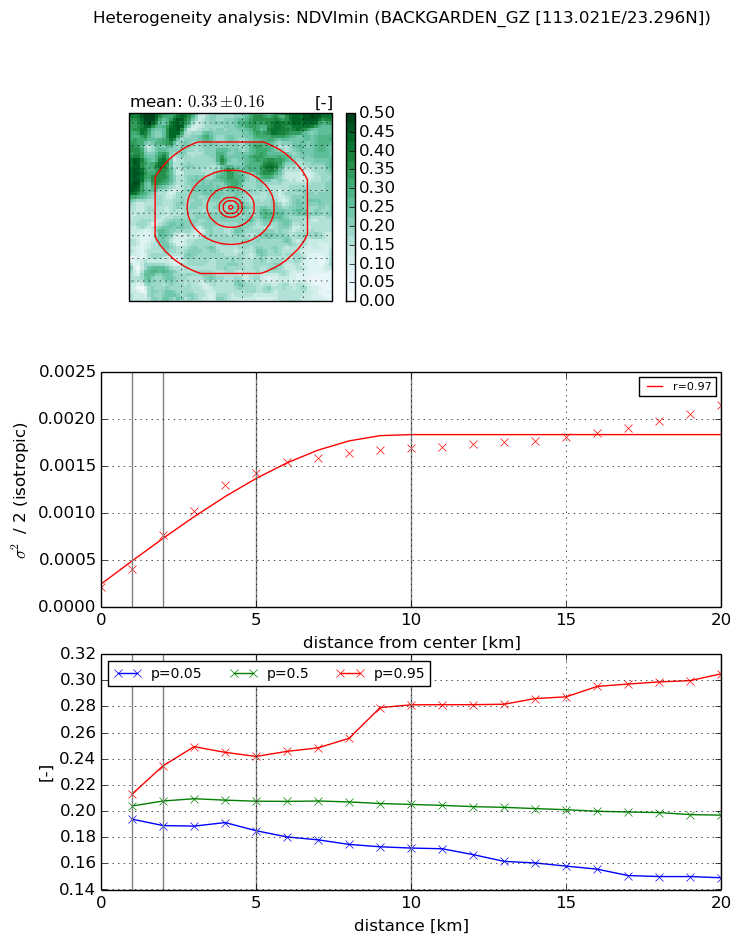
Heterogeneity analysis

The heterogeneity analysis provides information about the spatial and temporal heterogeneity of the site.

Topography


Roman et al. (2009) index


St

0.000529734496638

Rcv

-0.0492555964233

Rse

0.0

Rst

0.103984312377

Rsv

5663.06110433


Height range @ 1km [m]

5

Height range @ 2km [m]

6

Height range @ 5km [m]

45

Height range @ 10km [m]

-999

Height range @ 20km [m]

-999


Variance slope @ 1 km

367

Variance slope @ 2 km

253

Variance slope @ 5 km

66

Variance slope @ 10 km

-999

Variance slope @ 20 km

-999


NDVI (max. NDVI composite)


Roman et al. (2009) index


St

1.68989802493e-07

Rcv

-0.0556380304354

Rse

0.0

Rst

0.280259655499

Rsv

17752550.1479


NDVI range @ 1km [-]

0.04

NDVI range @ 2km [-]

0.09

NDVI range @ 5km [-]

0.11

NDVI range @ 10km [-]

0.17

NDVI range @ 20km [-]

0.23


Variance slope @ 1 km

0.000383318845479

Variance slope @ 2 km

0.000529394370872

Variance slope @ 5 km

0.000426090630432

Variance slope @ 10 km

0.000233941382524

Variance slope @ 20 km

0.000181842321881


NDVI (min. NDVI composite)I


Roman et al. (2009) index


St

1.86173795291

Rcv

-0.115545840467

Rse

0.0

Rst

0.882939619334

Rsv

-0.612912103061


NDVI range @ 1km [-]

0.02

NDVI range @ 2km [-]

0.05

NDVI range @ 5km [-]

0.06

NDVI range @ 10km [-]

0.11

NDVI range @ 20km [-]

0.16


NDVI slope @ 1 km

0.000190229347362

NDVI slope @ 2 km

0.000278302707447

NDVI slope @ 5 km

0.000258190608651

NDVI slope @ 10 km

0.000149598915569

NDVI slope @ 20 km

7.389955762e-05


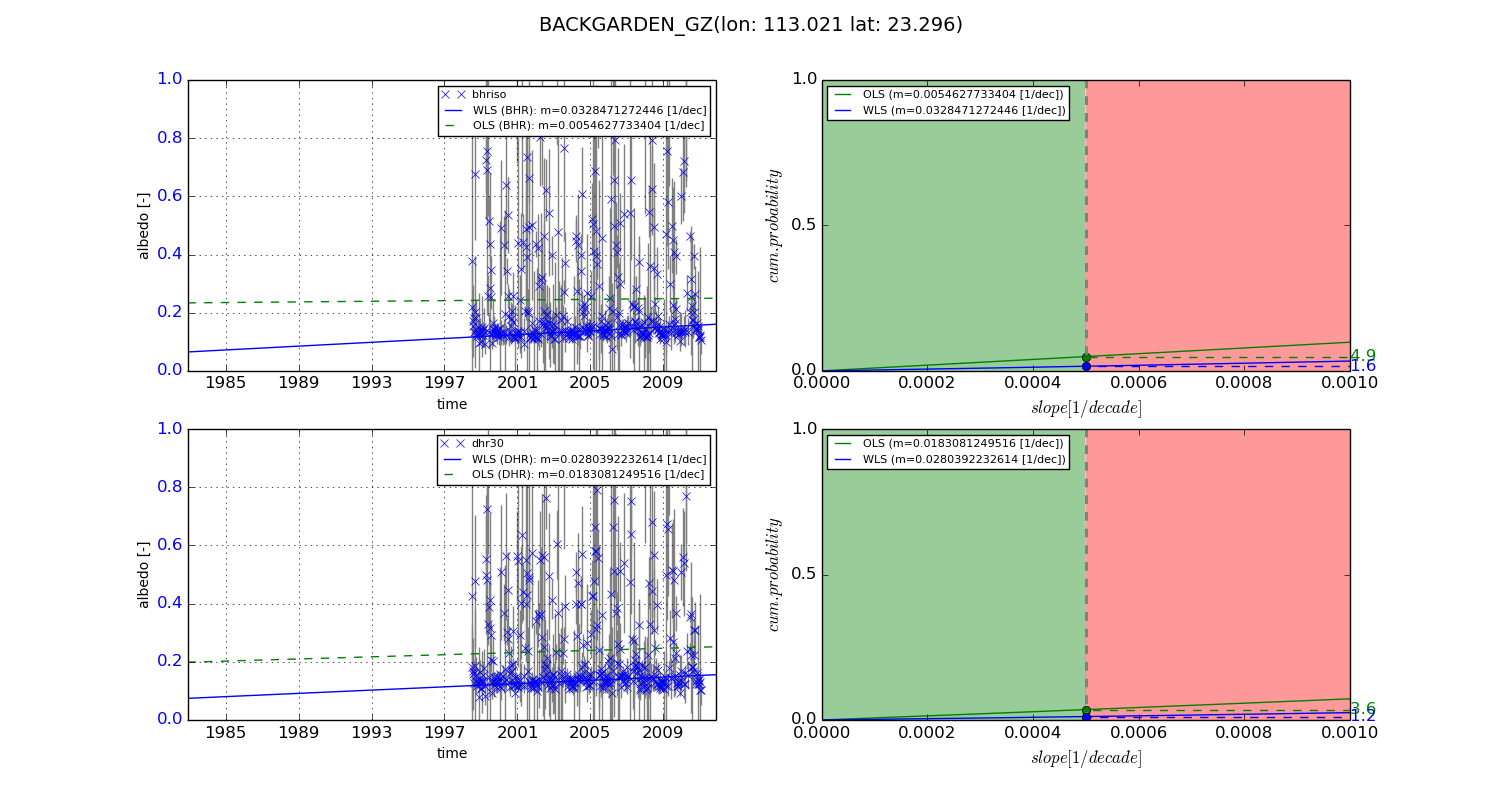
Temporal stability analysis

+000 deg (BHR)


BHR statistics

Temporal stability [1/decade]:


abs

rel


Weighted least square:

None


Ordinary least square:

None


Probabilities that GCOS criteria is met:

Weighted least square:

None %

Ordinary least square:

None %


DHR statistics

Temporal stability [1/decade]:


abs

rel


Weighted least square:

None


Ordinary least square:

None


Probabilities that GCOS criteria is met:

Weighted least square:

None %

Ordinary least square:

None %


+057/+063 deg (BHR)


BHR statistics

Temporal stability [1/decade]:


abs

rel


Weighted least square:

0.0328471272446


Ordinary least square:

0.0054627733404


Probabilities that GCOS criteria is met:

Weighted least square:

1.6 %

Ordinary least square:

4.9 %


DHR statistics

Temporal stability [1/decade]:


abs

rel


Weighted least square:

0.0280392232614


Ordinary least square:

0.0183081249516


Probabilities that GCOS criteria is met:

Weighted least square:

1.2 %

Ordinary least square:

3.6 %


Temporal anomaly analyis

The variance of the temporal anomalies provides an additional measure about the stability of the signal AFTER removal of the mean seasonal cylce.

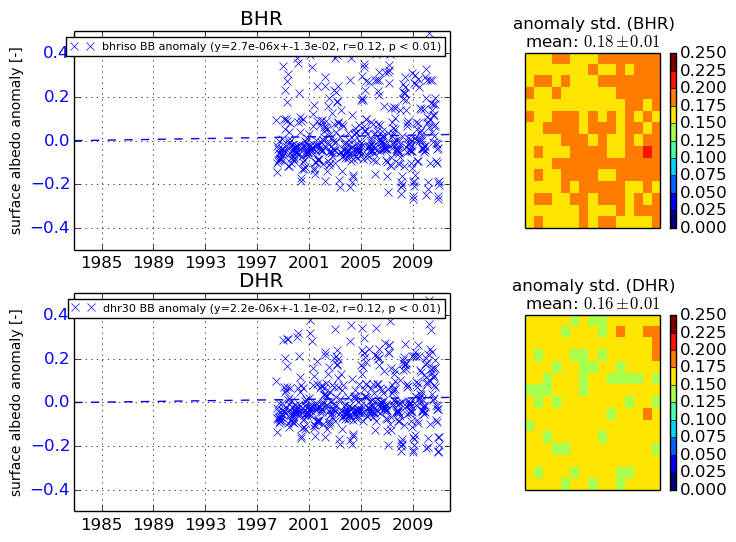
+000 deg


+057/+063 deg