BADAJOZ


Location

lon / lat [deg]: -7.0108 / 38.8828

Source network: AERONET


Geostationary surface albedo (GSA) data


“+000”


“+057/+063”


Landcover information (based on ESA CCI landcover data)


Landcover fractions @ 2km distance


Landcover fractions @ 20 km distance


Legend


Distance to open water bodies [km]:

0.92

Distance to urban areas [km]:

0.14


Radius: 1 km

Number of landcover classes:

4

Dominant landcover type:

190: urban areas

Fraction of dominant landcover type [%]:

37.0


Radius: 2 km

Number of landcover classes:

7

Dominant landcover type:

190: urban areas

Fraction of dominant landcover type [%]:

30.0


Radius: 5 km

Number of landcover classes:

5

Dominant landcover type:

20: cropland, irrigated or post-flooded

Fraction of dominant landcover type [%]:

40.0


Radius: 10 km

Number of landcover classes:

6

Dominant landcover type:

20: cropland, irrigated or post-flooded

Fraction of dominant landcover type [%]:

49.0


Radius: 20 km

Number of landcover classes:

6

Dominant landcover type:

10: cropland, rainfed

Fraction of dominant landcover type [%]:

49.0


Disturbances


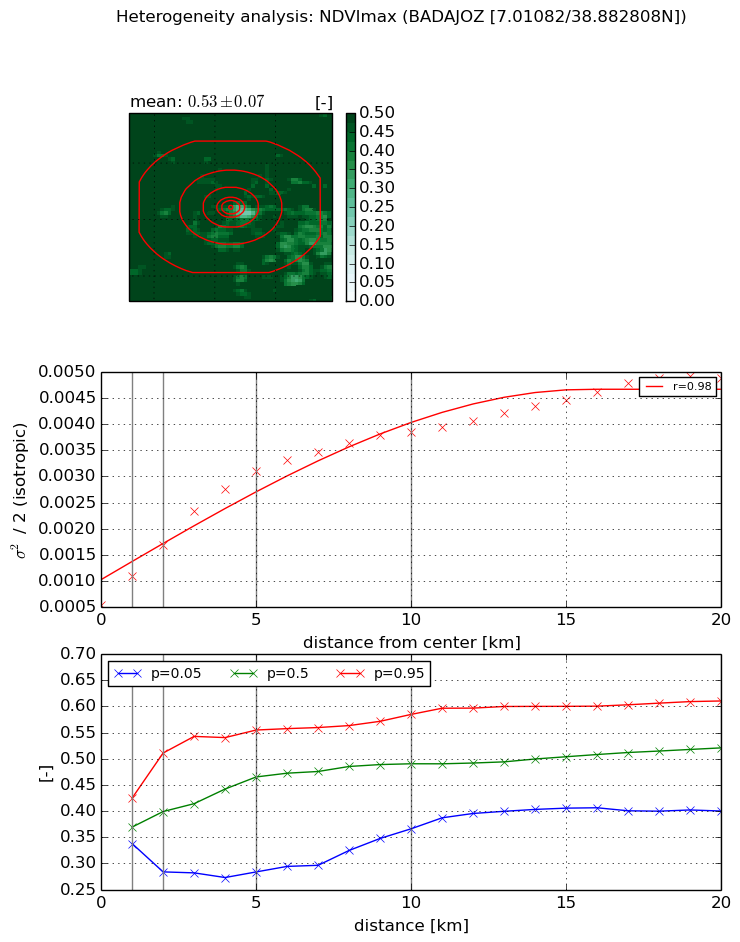
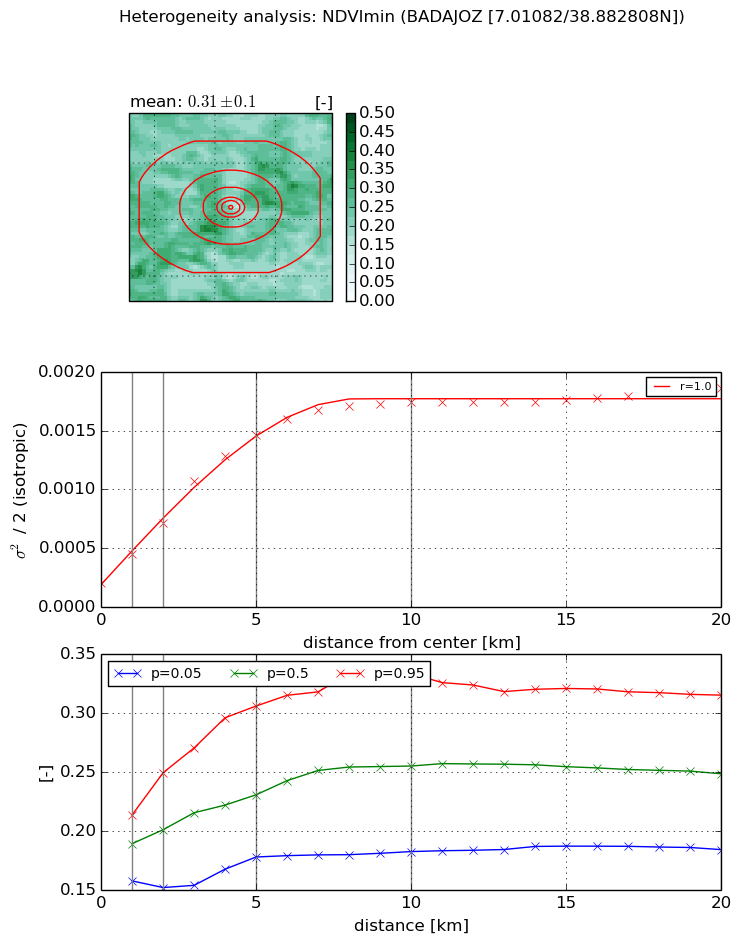
Heterogeneity analysis

The heterogeneity analysis provides information about the spatial and temporal heterogeneity of the site.

Topography


Roman et al. (2009) index


St

6.2989025991e-07

Rcv

0.203267466556

Rse

0.0

Rst

-0.0171988317979

Rsv

4762734.16509


Height range @ 1km [m]

16

Height range @ 2km [m]

25

Height range @ 5km [m]

43

Height range @ 10km [m]

-999

Height range @ 20km [m]

-999


Variance slope @ 1 km

71

Variance slope @ 2 km

69

Variance slope @ 5 km

49

Variance slope @ 10 km

-999

Variance slope @ 20 km

-999


NDVI (max. NDVI composite)


Roman et al. (2009) index


St

28.2243169767

Rcv

-0.0611534757841

Rse

0.0

Rst

-0.0187454130819

Rsv

0.0263924344096


NDVI range @ 1km [-]

0.09

NDVI range @ 2km [-]

0.23

NDVI range @ 5km [-]

0.27

NDVI range @ 10km [-]

0.22

NDVI range @ 20km [-]

0.21


Variance slope @ 1 km

0.000549079530134

Variance slope @ 2 km

0.000576681699369

Variance slope @ 5 km

0.00052567350658

Variance slope @ 10 km

0.000327321873234

Variance slope @ 20 km

0.000189311158449


NDVI (min. NDVI composite)I


Roman et al. (2009) index


St

11.7712769913

Rcv

0.12700865286

Rse

0.0

Rst

-0.0774673945238

Rsv

-0.0503816033374


NDVI range @ 1km [-]

0.06

NDVI range @ 2km [-]

0.1

NDVI range @ 5km [-]

0.13

NDVI range @ 10km [-]

0.15

NDVI range @ 20km [-]

0.13


NDVI slope @ 1 km

0.000241269171107

NDVI slope @ 2 km

0.000255724022771

NDVI slope @ 5 km

0.000260911194262

NDVI slope @ 10 km

0.000157128827128

NDVI slope @ 20 km

6.31395497886e-05


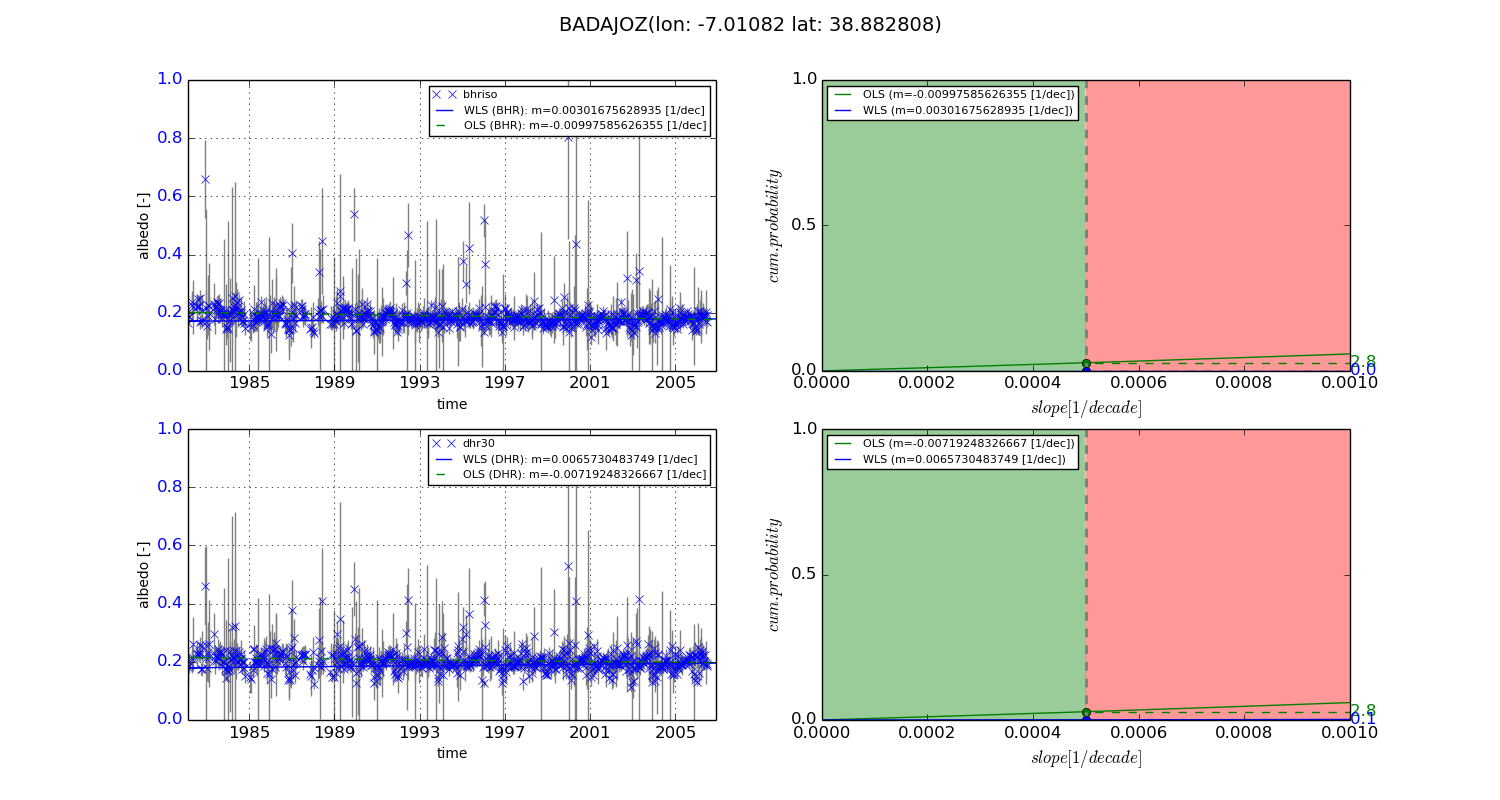
Temporal stability analysis

+000 deg (BHR)


BHR statistics

Temporal stability [1/decade]:


abs

rel


Weighted least square:

0.00301675628935


Ordinary least square:

-0.00997585626355


Probabilities that GCOS criteria is met:

Weighted least square:

0.0 %

Ordinary least square:

2.8 %


DHR statistics

Temporal stability [1/decade]:


abs

rel


Weighted least square:

0.0065730483749


Ordinary least square:

-0.00719248326667


Probabilities that GCOS criteria is met:

Weighted least square:

0.1 %

Ordinary least square:

2.8 %


+057/+063 deg (BHR)


BHR statistics

Temporal stability [1/decade]:


abs

rel


Weighted least square:

-99999.0


Ordinary least square:

-99999.0


Probabilities that GCOS criteria is met:

Weighted least square:

-99999.0 %

Ordinary least square:

-99999.0 %


DHR statistics

Temporal stability [1/decade]:


abs

rel


Weighted least square:

-99999.0


Ordinary least square:

-99999.0


Probabilities that GCOS criteria is met:

Weighted least square:

-99999.0 %

Ordinary least square:

-99999.0 %


Temporal anomaly analyis

The variance of the temporal anomalies provides an additional measure about the stability of the signal AFTER removal of the mean seasonal cylce.
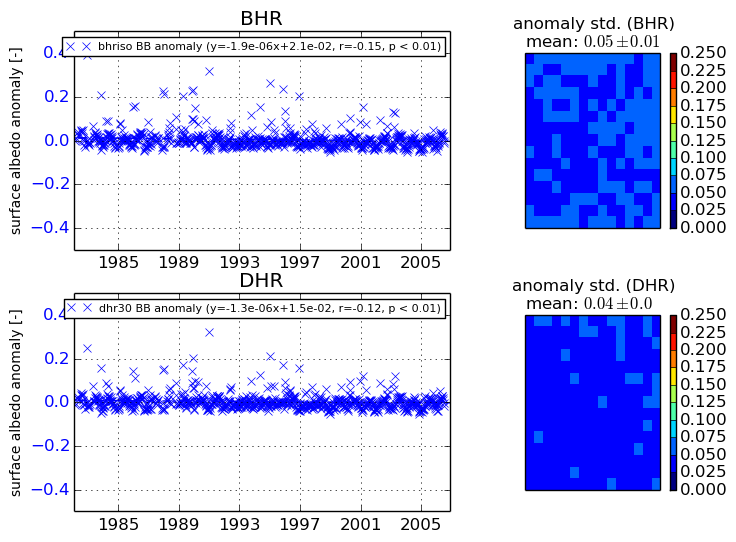
+000 deg


+057/+063 deg