BAGHDAD


Location

lon / lat [deg]: 44.4288 / 33.2919

Source network: AERONET


Geostationary surface albedo (GSA) data


“+000”


“+057/+063”


Landcover information (based on ESA CCI landcover data)


Landcover fractions @ 2km distance


Landcover fractions @ 20 km distance


Legend


Distance to open water bodies [km]:

0.34

Distance to urban areas [km]:

0.13


Radius: 1 km

Number of landcover classes:

2

Dominant landcover type:

190: urban areas

Fraction of dominant landcover type [%]:

82.0


Radius: 2 km

Number of landcover classes:

2

Dominant landcover type:

190: urban areas

Fraction of dominant landcover type [%]:

89.0


Radius: 5 km

Number of landcover classes:

4

Dominant landcover type:

190: urban areas

Fraction of dominant landcover type [%]:

89.0


Radius: 10 km

Number of landcover classes:

4

Dominant landcover type:

190: urban areas

Fraction of dominant landcover type [%]:

87.0


Radius: 20 km

Number of landcover classes:

5

Dominant landcover type:

190: urban areas

Fraction of dominant landcover type [%]:

50.0


Disturbances


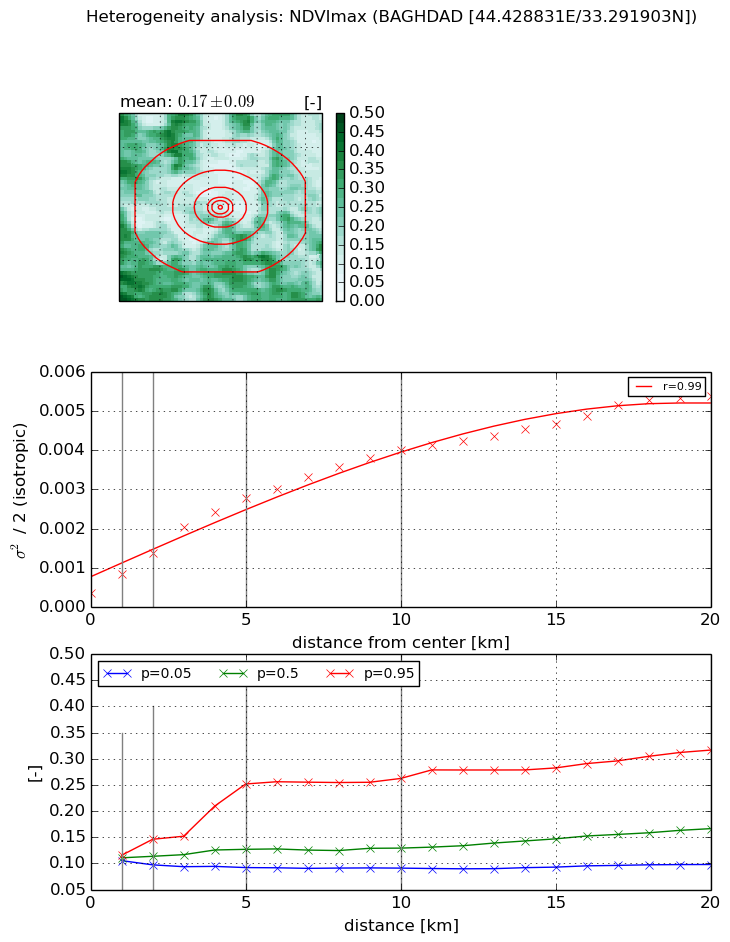
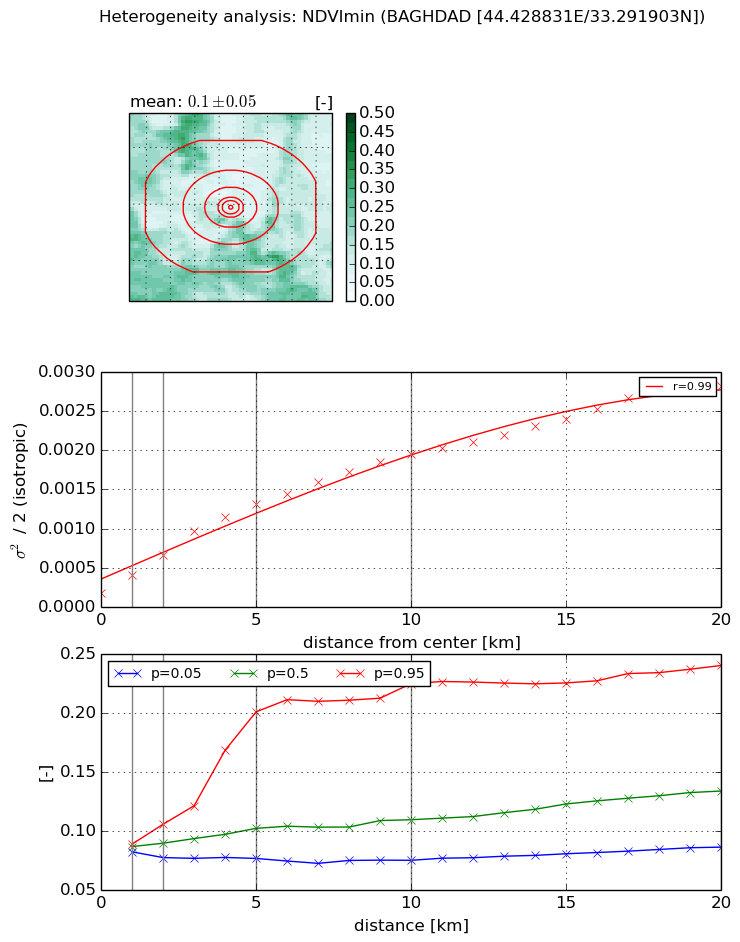
Heterogeneity analysis

The heterogeneity analysis provides information about the spatial and temporal heterogeneity of the site.

Topography


Roman et al. (2009) index


St

7.64377752435

Rcv

-0.0323111348286

Rse

0.0

Rst

-0.0529528381591

Rsv

0.307212128055


Height range @ 1km [m]

10

Height range @ 2km [m]

11

Height range @ 5km [m]

10

Height range @ 10km [m]

-999

Height range @ 20km [m]

-999


Variance slope @ 1 km

6

Variance slope @ 2 km

2

Variance slope @ 5 km

0

Variance slope @ 10 km

-999

Variance slope @ 20 km

-999


NDVI (max. NDVI composite)


Roman et al. (2009) index


St

1.40981096143

Rcv

0.943865917631

Rse

0.0

Rst

-0.184079102182

Rsv

-0.999999848028


NDVI range @ 1km [-]

0.01

NDVI range @ 2km [-]

0.05

NDVI range @ 5km [-]

0.16

NDVI range @ 10km [-]

0.17

NDVI range @ 20km [-]

0.22


Variance slope @ 1 km

0.000483123447692

Variance slope @ 2 km

0.000510440382205

Variance slope @ 5 km

0.000496082136485

Variance slope @ 10 km

0.000360108975859

Variance slope @ 20 km

0.000232096205465


NDVI (min. NDVI composite)I


Roman et al. (2009) index


St

1.25192515618

Rcv

1.2036648658

Rse

0.0

Rst

-0.192644808612

Rsv

-0.999999709726


NDVI range @ 1km [-]

0.01

NDVI range @ 2km [-]

0.03

NDVI range @ 5km [-]

0.12

NDVI range @ 10km [-]

0.15

NDVI range @ 20km [-]

0.15


NDVI slope @ 1 km

0.000228586390327

NDVI slope @ 2 km

0.000242977255694

NDVI slope @ 5 km

0.000235060688716

NDVI slope @ 10 km

0.000175983642189

NDVI slope @ 20 km

0.000124827510359


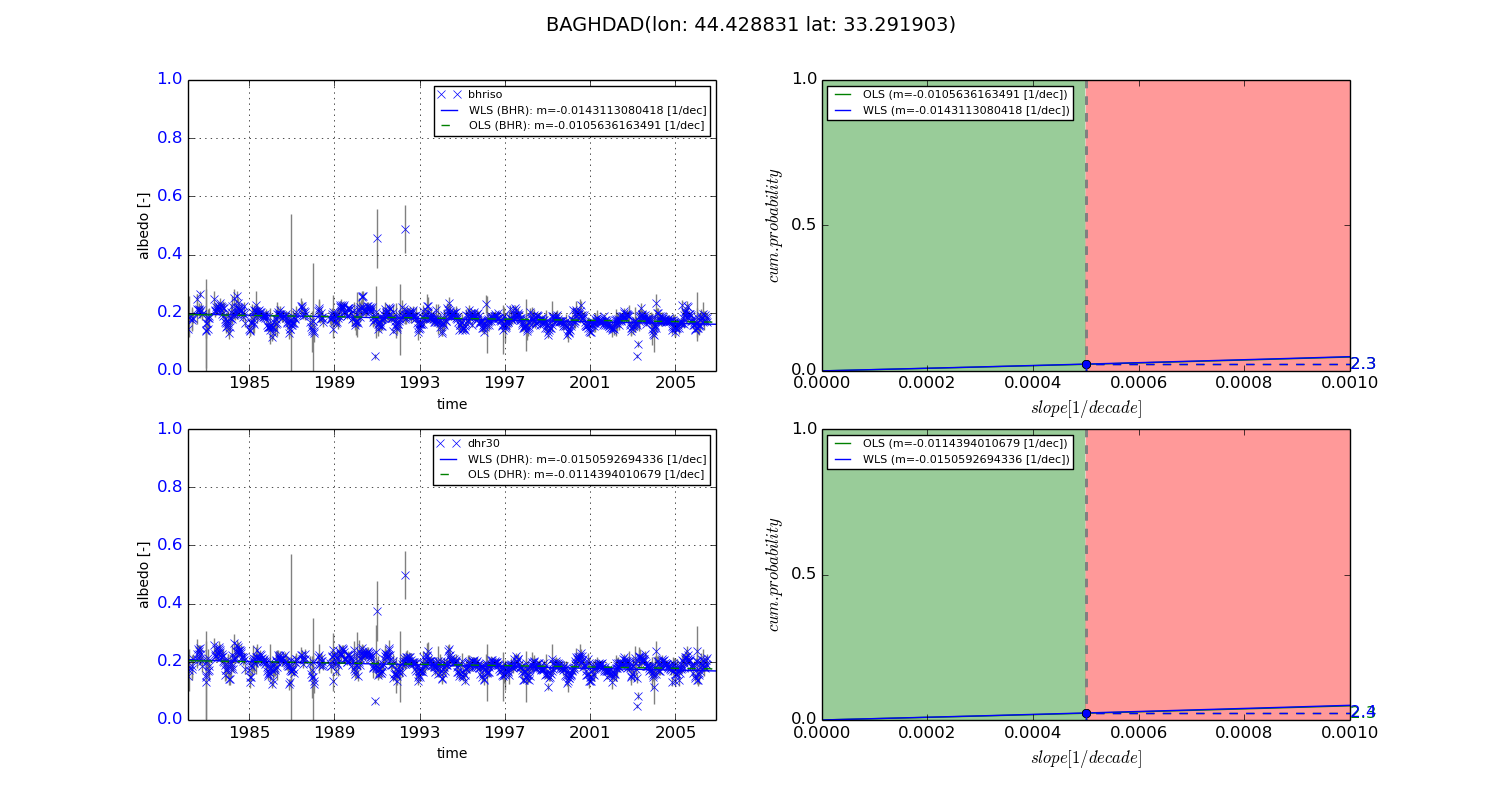
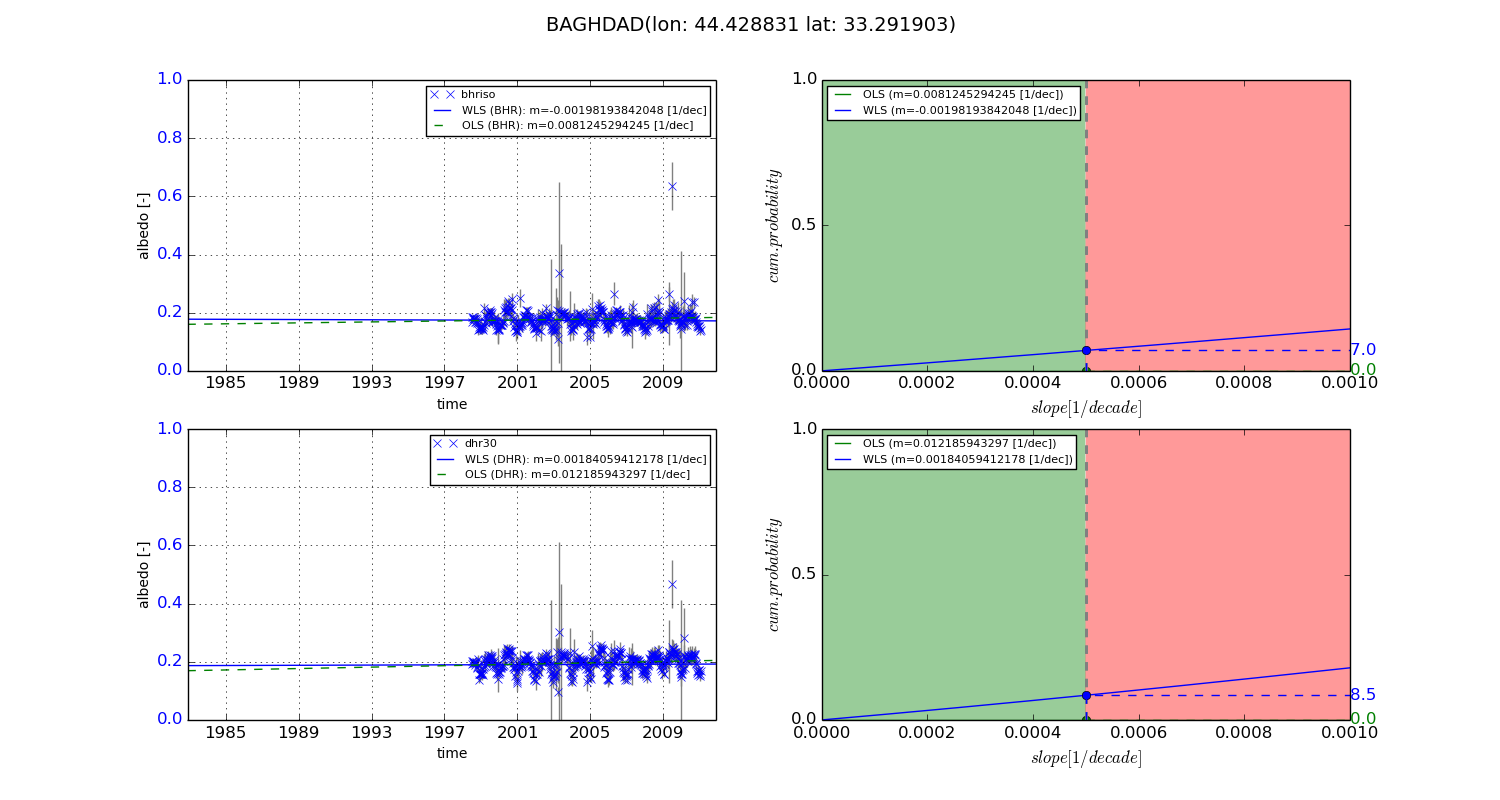
Temporal stability analysis

+000 deg (BHR)


BHR statistics

Temporal stability [1/decade]:


abs

rel


Weighted least square:

-0.0143113080418


Ordinary least square:

-0.0105636163491


Probabilities that GCOS criteria is met:

Weighted least square:

2.3 %

Ordinary least square:

2.3 %


DHR statistics

Temporal stability [1/decade]:


abs

rel


Weighted least square:

-0.0150592694336


Ordinary least square:

-0.0114394010679


Probabilities that GCOS criteria is met:

Weighted least square:

2.4 %

Ordinary least square:

2.3 %


+057/+063 deg (BHR)


BHR statistics

Temporal stability [1/decade]:


abs

rel


Weighted least square:

-0.00198193842048


Ordinary least square:

0.0081245294245


Probabilities that GCOS criteria is met:

Weighted least square:

7.0 %

Ordinary least square:

0.0 %


DHR statistics

Temporal stability [1/decade]:


abs

rel


Weighted least square:

0.00184059412178


Ordinary least square:

0.012185943297


Probabilities that GCOS criteria is met:

Weighted least square:

8.5 %

Ordinary least square:

0.0 %


Temporal anomaly analyis

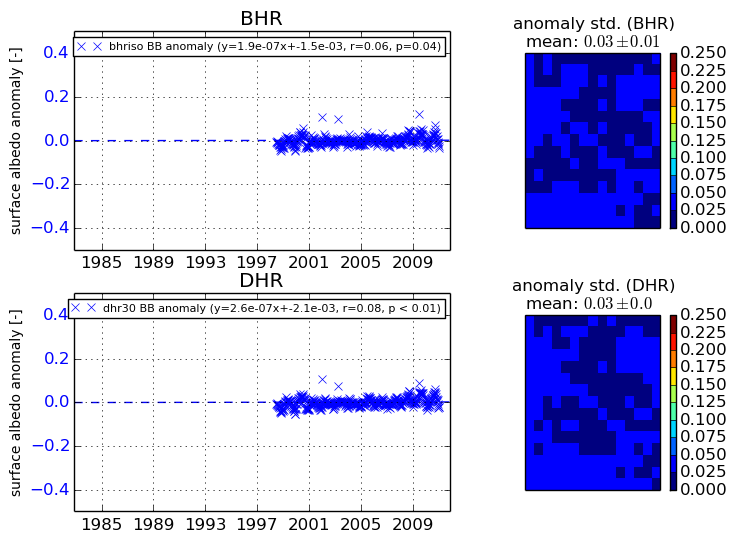
The variance of the temporal anomalies provides an additional measure about the stability of the signal AFTER removal of the mean seasonal cylce.
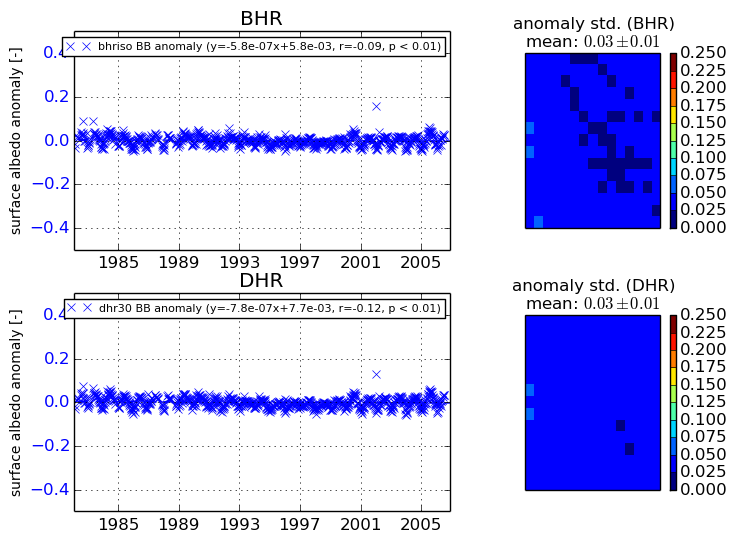
+000 deg


+057/+063 deg