BAMBEY-ISRA


Location

lon / lat [deg]: -16.4767 / 14.7086

Source network: AERONET


Geostationary surface albedo (GSA) data


“+000”


“+057/+063”


Landcover information (based on ESA CCI landcover data)


Landcover fractions @ 2km distance


Landcover fractions @ 20 km distance


Legend


Distance to open water bodies [km]:

40.3

Distance to urban areas [km]:

1.61


Radius: 1 km

Number of landcover classes:

2

Dominant landcover type:

20: cropland, irrigated or post-flooded

Fraction of dominant landcover type [%]:

54.0


Radius: 2 km

Number of landcover classes:

3

Dominant landcover type:

10: cropland, rainfed

Fraction of dominant landcover type [%]:

72.0


Radius: 5 km

Number of landcover classes:

3

Dominant landcover type:

10: cropland, rainfed

Fraction of dominant landcover type [%]:

89.0


Radius: 10 km

Number of landcover classes:

3

Dominant landcover type:

10: cropland, rainfed

Fraction of dominant landcover type [%]:

97.0


Radius: 20 km

Number of landcover classes:

1

Dominant landcover type:

10: cropland, rainfed

Fraction of dominant landcover type [%]:

99.0


Disturbances


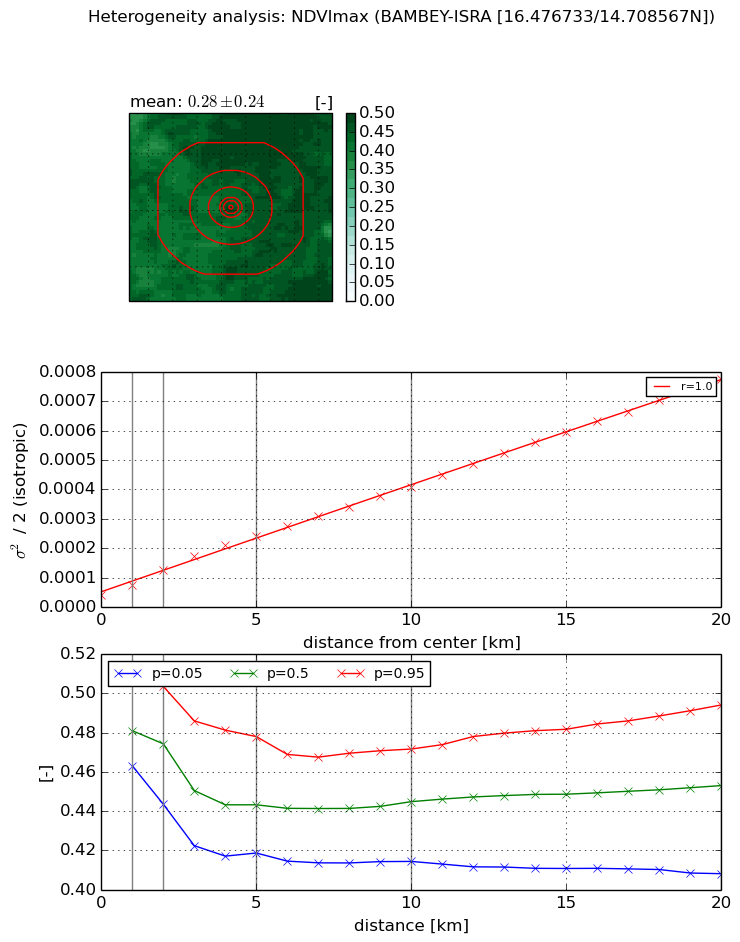
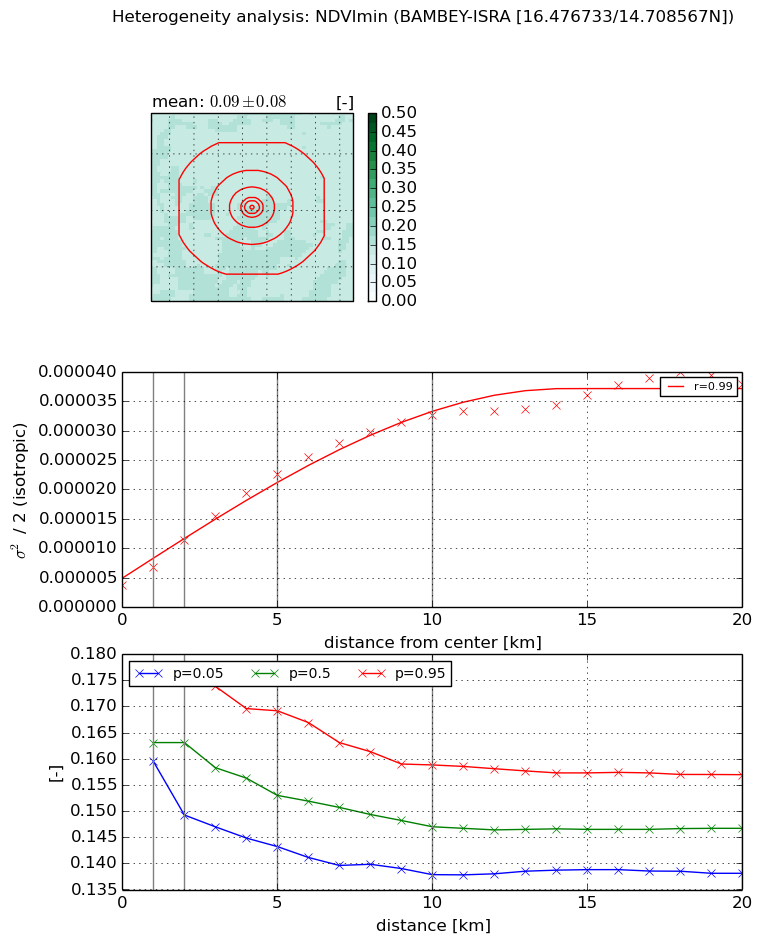
Heterogeneity analysis

The heterogeneity analysis provides information about the spatial and temporal heterogeneity of the site.

Topography


Roman et al. (2009) index


St

0.111869827007

Rcv

0.259675193592

Rse

0.0

Rst

1.4510245149e-06

Rsv

26.5572058006


Height range @ 1km [m]

5

Height range @ 2km [m]

7

Height range @ 5km [m]

11

Height range @ 10km [m]

-999

Height range @ 20km [m]

-999


Variance slope @ 1 km

2

Variance slope @ 2 km

1

Variance slope @ 5 km

2

Variance slope @ 10 km

-999

Variance slope @ 20 km

-999


NDVI (max. NDVI composite)


Roman et al. (2009) index


St

1.05114408512

Rcv

-0.178927885107

Rse

0.0

Rst

-0.00648116280457

Rsv

2.66862404086


NDVI range @ 1km [-]

0.05

NDVI range @ 2km [-]

0.06

NDVI range @ 5km [-]

0.06

NDVI range @ 10km [-]

0.06

NDVI range @ 20km [-]

0.09


Variance slope @ 1 km

3.31682665402e-05

Variance slope @ 2 km

4.22939627656e-05

Variance slope @ 5 km

4.17892190519e-05

Variance slope @ 10 km

3.65900069449e-05

Variance slope @ 20 km

3.61188639128e-05


NDVI (min. NDVI composite)I


Roman et al. (2009) index


St

3.90862433706

Rcv

-0.12270496586

Rse

0.0

Rst

-0.207098358169

Rsv

0.437730145881


NDVI range @ 1km [-]

0.02

NDVI range @ 2km [-]

0.03

NDVI range @ 5km [-]

0.03

NDVI range @ 10km [-]

0.02

NDVI range @ 20km [-]

0.02


NDVI slope @ 1 km

3.03882265144e-06

NDVI slope @ 2 km

3.82408035638e-06

NDVI slope @ 5 km

3.86737606307e-06

NDVI slope @ 10 km

2.9926520462e-06

NDVI slope @ 20 km

1.64303851543e-06


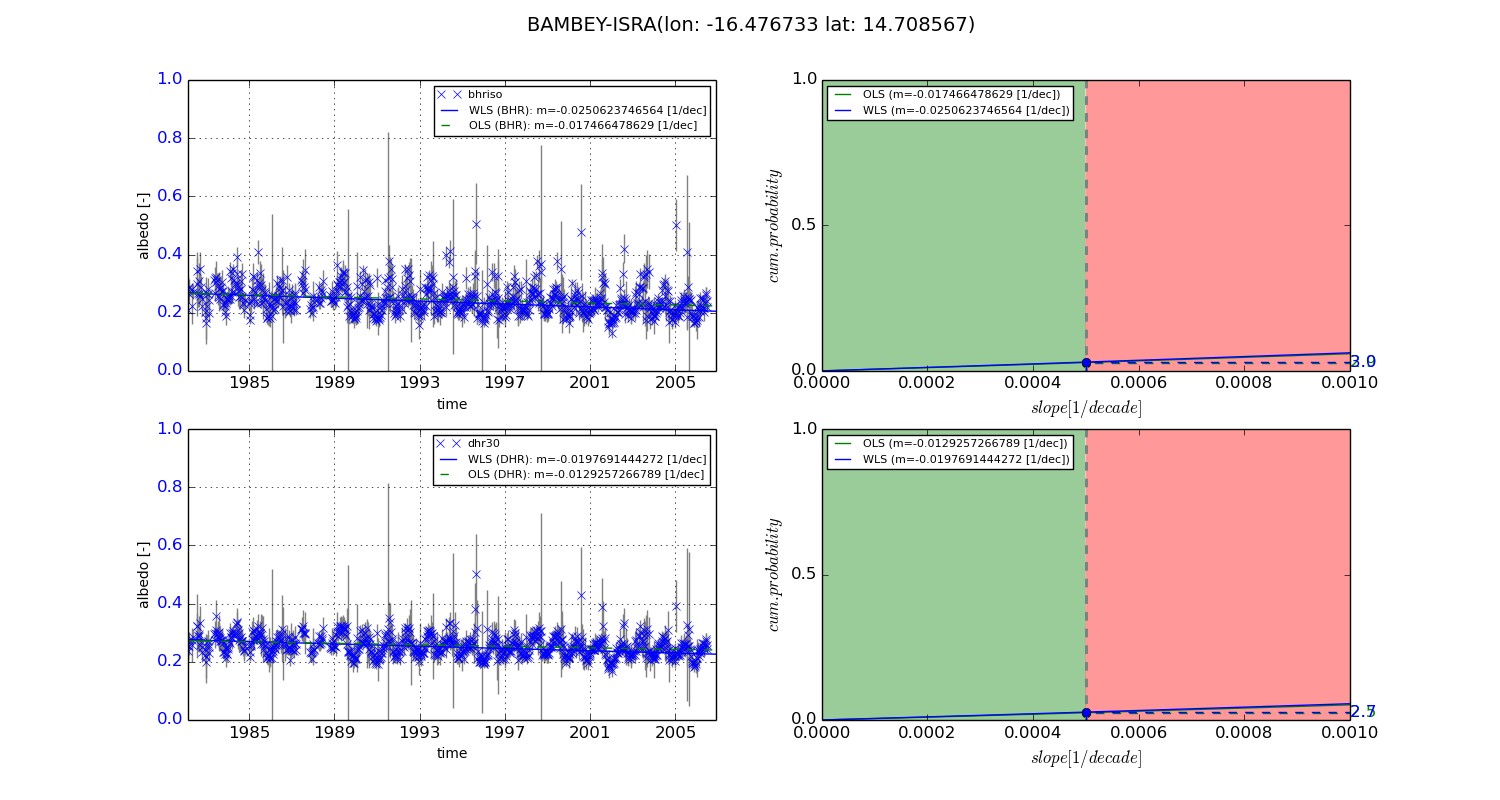
Temporal stability analysis

+000 deg (BHR)


BHR statistics

Temporal stability [1/decade]:


abs

rel


Weighted least square:

-0.0250623746564


Ordinary least square:

-0.017466478629


Probabilities that GCOS criteria is met:

Weighted least square:

3.0 %

Ordinary least square:

2.9 %


DHR statistics

Temporal stability [1/decade]:


abs

rel


Weighted least square:

-0.0197691444272


Ordinary least square:

-0.0129257266789


Probabilities that GCOS criteria is met:

Weighted least square:

2.7 %

Ordinary least square:

2.5 %


+057/+063 deg (BHR)


BHR statistics

Temporal stability [1/decade]:


abs

rel


Weighted least square:

-99999.0


Ordinary least square:

-99999.0


Probabilities that GCOS criteria is met:

Weighted least square:

-99999.0 %

Ordinary least square:

-99999.0 %


DHR statistics

Temporal stability [1/decade]:


abs

rel


Weighted least square:

-99999.0


Ordinary least square:

-99999.0


Probabilities that GCOS criteria is met:

Weighted least square:

-99999.0 %

Ordinary least square:

-99999.0 %


Temporal anomaly analyis

The variance of the temporal anomalies provides an additional measure about the stability of the signal AFTER removal of the mean seasonal cylce.
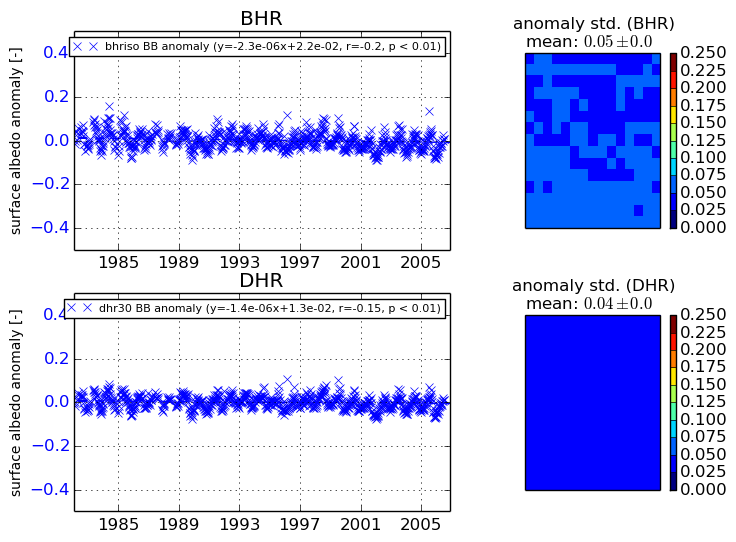
+000 deg


+057/+063 deg