BANDUNG


Location

lon / lat [deg]: 107.61 / -6.8884

Source network: AERONET


Geostationary surface albedo (GSA) data


“+000”


“+057/+063”


Landcover information (based on ESA CCI landcover data)


Landcover fractions @ 2km distance


Landcover fractions @ 20 km distance


Legend


Distance to open water bodies [km]:

10.87

Distance to urban areas [km]:

0.11


Radius: 1 km

Number of landcover classes:

1

Dominant landcover type:

190: urban areas

Fraction of dominant landcover type [%]:

100.0


Radius: 2 km

Number of landcover classes:

1

Dominant landcover type:

190: urban areas

Fraction of dominant landcover type [%]:

100.0


Radius: 5 km

Number of landcover classes:

3

Dominant landcover type:

190: urban areas

Fraction of dominant landcover type [%]:

96.0


Radius: 10 km

Number of landcover classes:

5

Dominant landcover type:

190: urban areas

Fraction of dominant landcover type [%]:

78.0


Radius: 20 km

Number of landcover classes:

8

Dominant landcover type:

30: mosaic cropland (>50%), natural veg. (< 50%)

Fraction of dominant landcover type [%]:

37.0


Disturbances


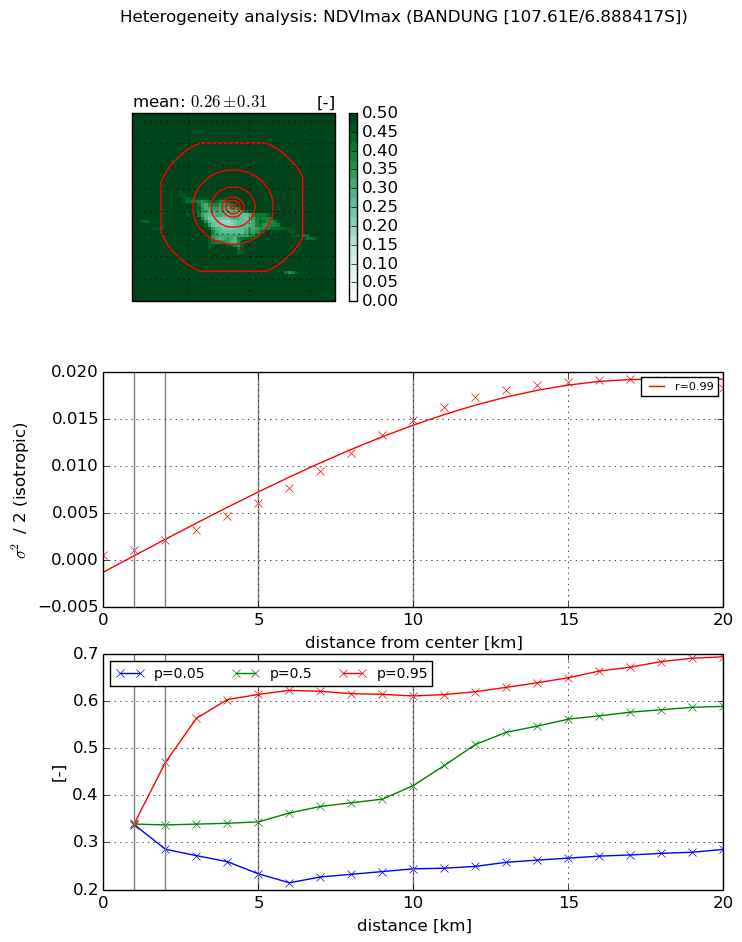
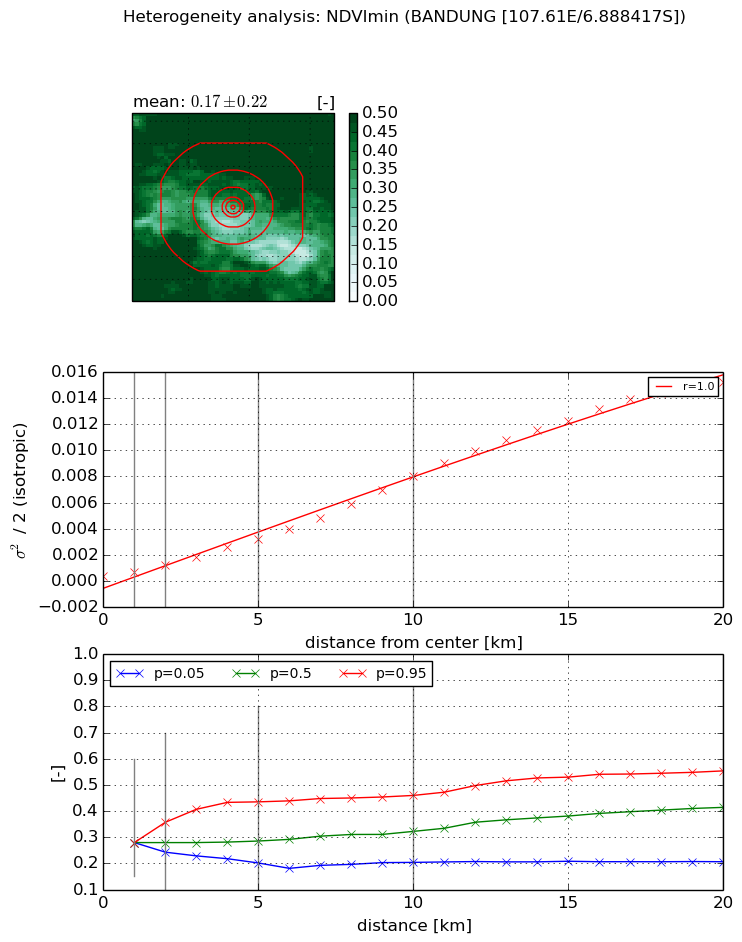
Heterogeneity analysis

The heterogeneity analysis provides information about the spatial and temporal heterogeneity of the site.

Topography


Roman et al. (2009) index


St

1.63110177277

Rcv

0.839247532873

Rse

0.0

Rst

-5.42997184375e-08

Rsv

-1.0


Height range @ 1km [m]

55

Height range @ 2km [m]

94

Height range @ 5km [m]

278

Height range @ 10km [m]

-999

Height range @ 20km [m]

-999


Variance slope @ 1 km

635

Variance slope @ 2 km

999

Variance slope @ 5 km

1859

Variance slope @ 10 km

-999

Variance slope @ 20 km

-999


NDVI (max. NDVI composite)


Roman et al. (2009) index


St

4.8569534139

Rcv

0.230248715035

Rse

0.0

Rst

-2.57933327601e-08

Rsv

-0.387422409036


NDVI range @ 1km [-]

0.0

NDVI range @ 2km [-]

0.18

NDVI range @ 5km [-]

0.38

NDVI range @ 10km [-]

0.37

NDVI range @ 20km [-]

0.41


Variance slope @ 1 km

0.00055013426081

Variance slope @ 2 km

0.000789091818259

Variance slope @ 5 km

0.00112938684079

Variance slope @ 10 km

0.00148438432167

Variance slope @ 20 km

0.00106521954839


NDVI (min. NDVI composite)I


Roman et al. (2009) index


St

4.33513117466

Rcv

0.315915872634

Rse

0.0

Rst

-6.24352621746e-09

Rsv

0.376104703461


NDVI range @ 1km [-]

0.0

NDVI range @ 2km [-]

0.11

NDVI range @ 5km [-]

0.23

NDVI range @ 10km [-]

0.26

NDVI range @ 20km [-]

0.35


NDVI slope @ 1 km

0.000315564075104

NDVI slope @ 2 km

0.00044528033765

NDVI slope @ 5 km

0.000588490972145

NDVI slope @ 10 km

0.000770305309

NDVI slope @ 20 km

0.000820849722429


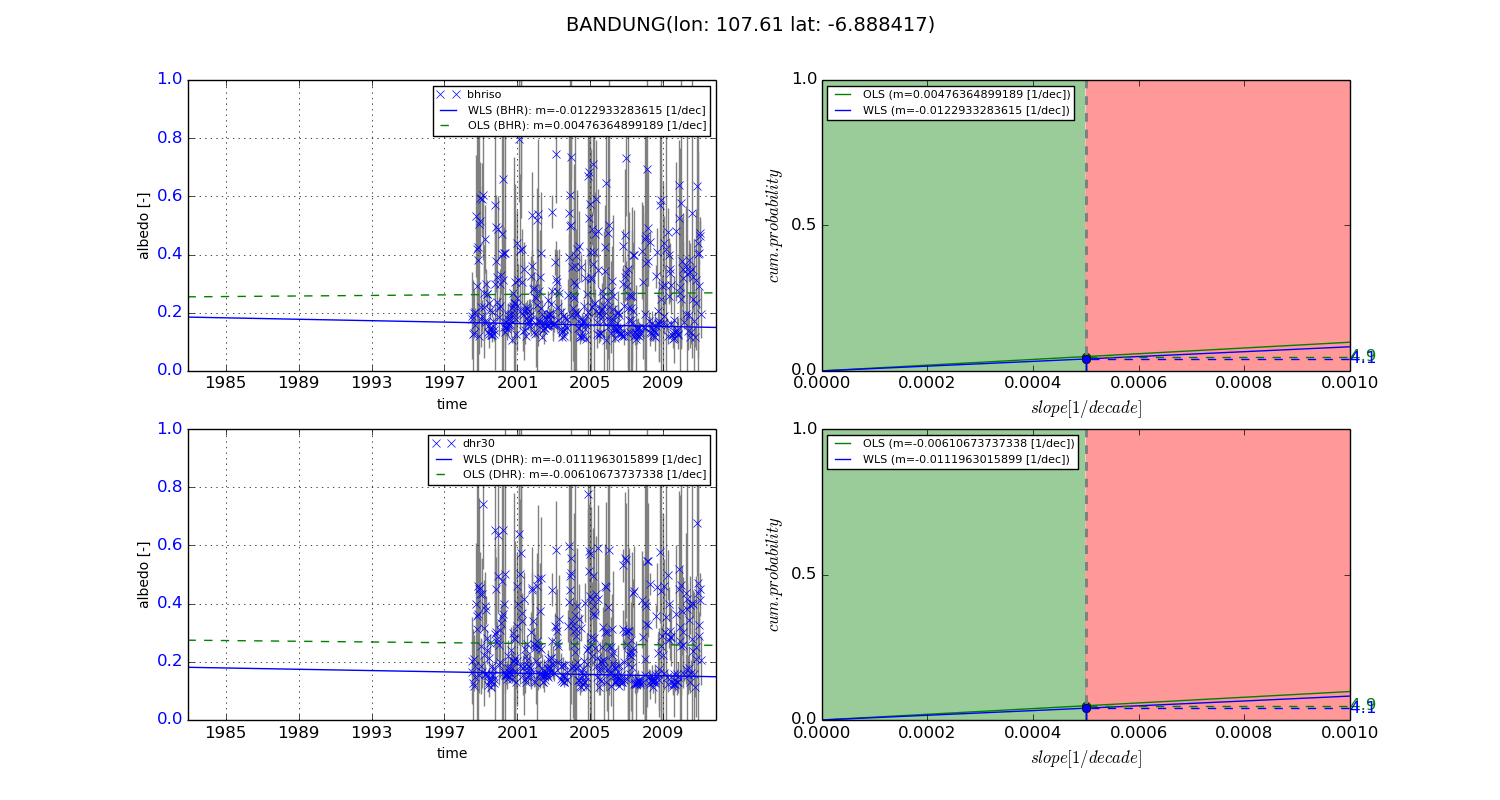
Temporal stability analysis

+000 deg (BHR)


BHR statistics

Temporal stability [1/decade]:


abs

rel


Weighted least square:

None


Ordinary least square:

None


Probabilities that GCOS criteria is met:

Weighted least square:

None %

Ordinary least square:

None %


DHR statistics

Temporal stability [1/decade]:


abs

rel


Weighted least square:

None


Ordinary least square:

None


Probabilities that GCOS criteria is met:

Weighted least square:

None %

Ordinary least square:

None %


+057/+063 deg (BHR)


BHR statistics

Temporal stability [1/decade]:


abs

rel


Weighted least square:

-0.0122933283615


Ordinary least square:

0.00476364899189


Probabilities that GCOS criteria is met:

Weighted least square:

4.1 %

Ordinary least square:

4.9 %


DHR statistics

Temporal stability [1/decade]:


abs

rel


Weighted least square:

-0.0111963015899


Ordinary least square:

-0.00610673737338


Probabilities that GCOS criteria is met:

Weighted least square:

4.1 %

Ordinary least square:

4.9 %


Temporal anomaly analyis

The variance of the temporal anomalies provides an additional measure about the stability of the signal AFTER removal of the mean seasonal cylce.

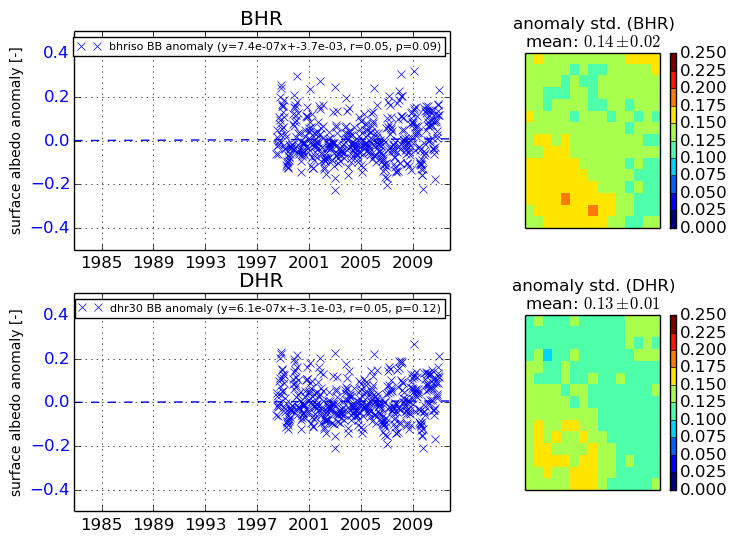
+000 deg


+057/+063 deg