BANEASA


Location

lon / lat [deg]: 26.0778 / 44.5113

Source network: AERONET


Geostationary surface albedo (GSA) data


“+000”


“+057/+063”


Landcover information (based on ESA CCI landcover data)


Landcover fractions @ 2km distance


Landcover fractions @ 20 km distance


Legend


Distance to open water bodies [km]:

2.55

Distance to urban areas [km]:

0.17


Radius: 1 km

Number of landcover classes:

3

Dominant landcover type:

190: urban areas

Fraction of dominant landcover type [%]:

89.0


Radius: 2 km

Number of landcover classes:

3

Dominant landcover type:

190: urban areas

Fraction of dominant landcover type [%]:

75.0


Radius: 5 km

Number of landcover classes:

4

Dominant landcover type:

190: urban areas

Fraction of dominant landcover type [%]:

68.0


Radius: 10 km

Number of landcover classes:

4

Dominant landcover type:

190: urban areas

Fraction of dominant landcover type [%]:

59.0


Radius: 20 km

Number of landcover classes:

4

Dominant landcover type:

10: cropland, rainfed

Fraction of dominant landcover type [%]:

51.0


Disturbances


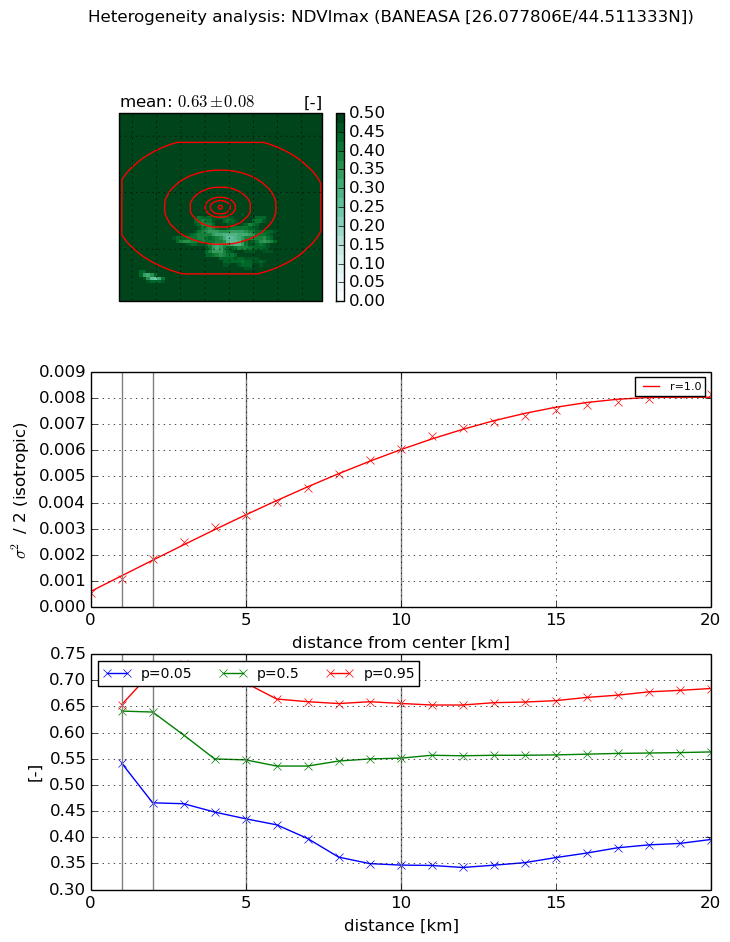
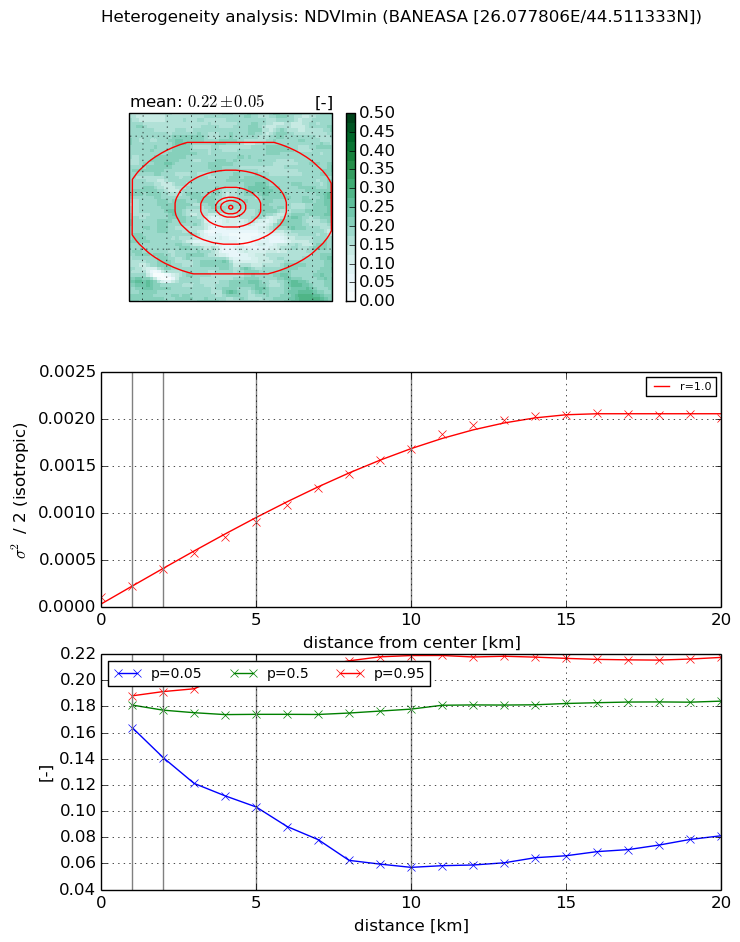
Heterogeneity analysis

The heterogeneity analysis provides information about the spatial and temporal heterogeneity of the site.

Topography


Roman et al. (2009) index


St

9.82618422762

Rcv

-0.0480924014414

Rse

0.0

Rst

-0.144332037804

Rsv

0.112882272954


Height range @ 1km [m]

12

Height range @ 2km [m]

19

Height range @ 5km [m]

21

Height range @ 10km [m]

-999

Height range @ 20km [m]

-999


Variance slope @ 1 km

15

Variance slope @ 2 km

11

Variance slope @ 5 km

6

Variance slope @ 10 km

-999

Variance slope @ 20 km

-999


NDVI (max. NDVI composite)


Roman et al. (2009) index


St

2.51654076367e-07

Rcv

-0.0196919206795

Rse

0.0

Rst

0.251398712954

Rsv

11921125.9165


NDVI range @ 1km [-]

0.11

NDVI range @ 2km [-]

0.25

NDVI range @ 5km [-]

0.26

NDVI range @ 10km [-]

0.31

NDVI range @ 20km [-]

0.29


Variance slope @ 1 km

0.000554597358072

Variance slope @ 2 km

0.0006568728914

Variance slope @ 5 km

0.000614170598761

Variance slope @ 10 km

0.000552862216759

Variance slope @ 20 km

0.000389184542591


NDVI (min. NDVI composite)I


Roman et al. (2009) index


St

1.06593275587e-07

Rcv

0.537605550688

Rse

0.0

Rst

0.0374953786931

Rsv

28144363.9121


NDVI range @ 1km [-]

0.02

NDVI range @ 2km [-]

0.05

NDVI range @ 5km [-]

0.1

NDVI range @ 10km [-]

0.16

NDVI range @ 20km [-]

0.14


NDVI slope @ 1 km

0.000118011566011

NDVI slope @ 2 km

0.000145882559699

NDVI slope @ 5 km

0.000162779096395

NDVI slope @ 10 km

0.000163454105534

NDVI slope @ 20 km

0.000103519660339


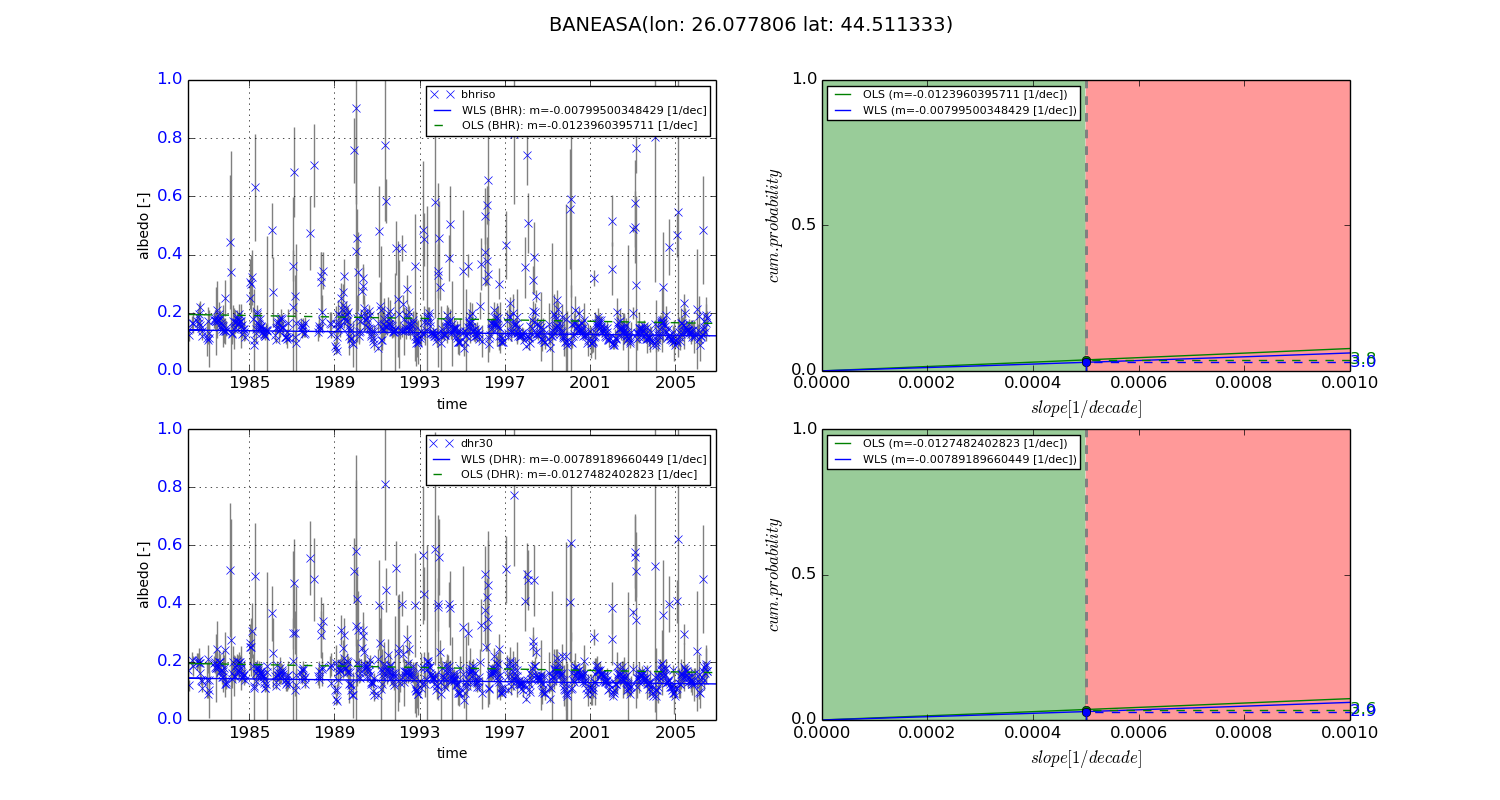
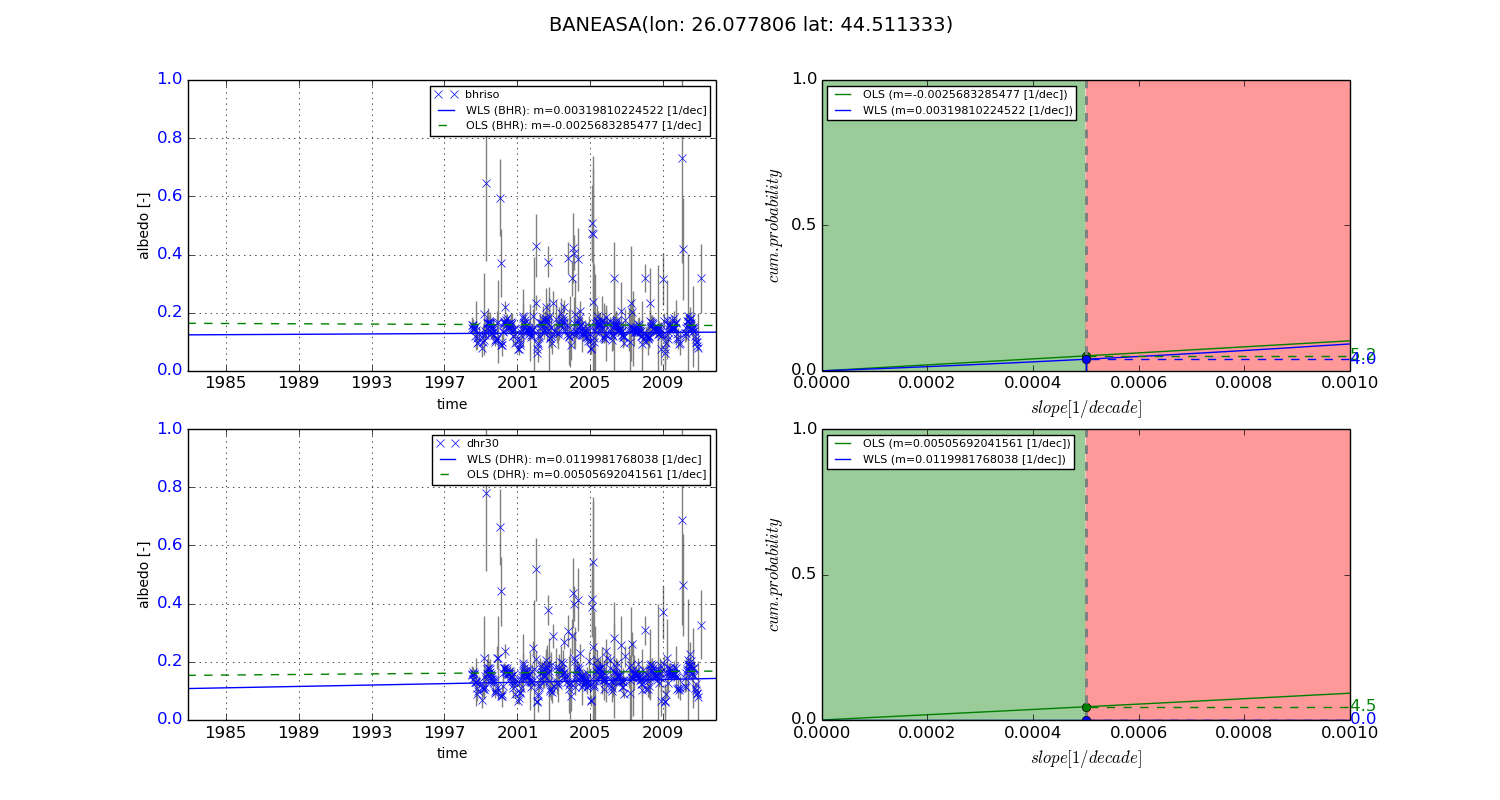
Temporal stability analysis

+000 deg (BHR)


BHR statistics

Temporal stability [1/decade]:


abs

rel


Weighted least square:

-0.00799500348429


Ordinary least square:

-0.0123960395711


Probabilities that GCOS criteria is met:

Weighted least square:

3.0 %

Ordinary least square:

3.8 %


DHR statistics

Temporal stability [1/decade]:


abs

rel


Weighted least square:

-0.00789189660449


Ordinary least square:

-0.0127482402823


Probabilities that GCOS criteria is met:

Weighted least square:

2.9 %

Ordinary least square:

3.6 %


+057/+063 deg (BHR)


BHR statistics

Temporal stability [1/decade]:


abs

rel


Weighted least square:

0.00319810224522


Ordinary least square:

-0.0025683285477


Probabilities that GCOS criteria is met:

Weighted least square:

4.0 %

Ordinary least square:

5.2 %


DHR statistics

Temporal stability [1/decade]:


abs

rel


Weighted least square:

0.0119981768038


Ordinary least square:

0.00505692041561


Probabilities that GCOS criteria is met:

Weighted least square:

0.0 %

Ordinary least square:

4.5 %


Temporal anomaly analyis

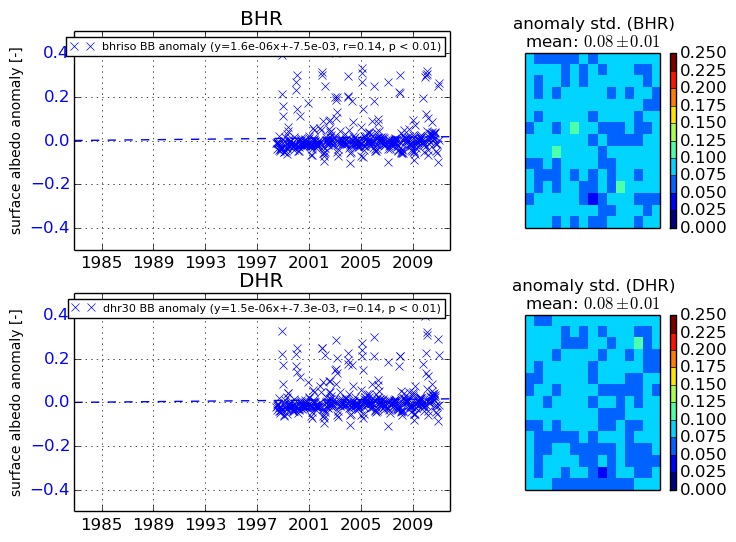
The variance of the temporal anomalies provides an additional measure about the stability of the signal AFTER removal of the mean seasonal cylce.
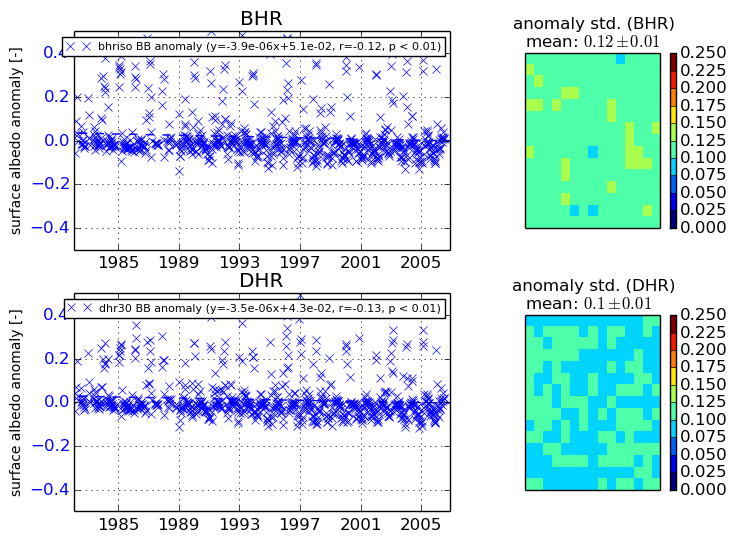
+000 deg


+057/+063 deg