BANIZOUMBOU


Location

lon / lat [deg]: 2.6648 / 13.5412

Source network: AERONET


Geostationary surface albedo (GSA) data


“+000”


“+057/+063”


Landcover information (based on ESA CCI landcover data)


Landcover fractions @ 2km distance


Landcover fractions @ 20 km distance


Legend


Distance to open water bodies [km]:

44.37

Distance to urban areas [km]:

11.98


Radius: 1 km

Number of landcover classes:

2

Dominant landcover type:

10: cropland, rainfed

Fraction of dominant landcover type [%]:

91.0


Radius: 2 km

Number of landcover classes:

2

Dominant landcover type:

10: cropland, rainfed

Fraction of dominant landcover type [%]:

91.0


Radius: 5 km

Number of landcover classes:

3

Dominant landcover type:

10: cropland, rainfed

Fraction of dominant landcover type [%]:

87.0


Radius: 10 km

Number of landcover classes:

4

Dominant landcover type:

10: cropland, rainfed

Fraction of dominant landcover type [%]:

79.0


Radius: 20 km

Number of landcover classes:

4

Dominant landcover type:

10: cropland, rainfed

Fraction of dominant landcover type [%]:

68.0


Disturbances


Heterogeneity analysis

The heterogeneity analysis provides information about the spatial and temporal heterogeneity of the site.

Topography


Roman et al. (2009) index


St

2.22477495361

Rcv

0.70349086141

Rse

0.0

Rst

-0.00753693798656

Rsv

0.637423195675


Height range @ 1km [m]

23

Height range @ 2km [m]

20

Height range @ 5km [m]

48

Height range @ 10km [m]

-999

Height range @ 20km [m]

-999


Variance slope @ 1 km

46

Variance slope @ 2 km

59

Variance slope @ 5 km

58

Variance slope @ 10 km

-999

Variance slope @ 20 km

-999


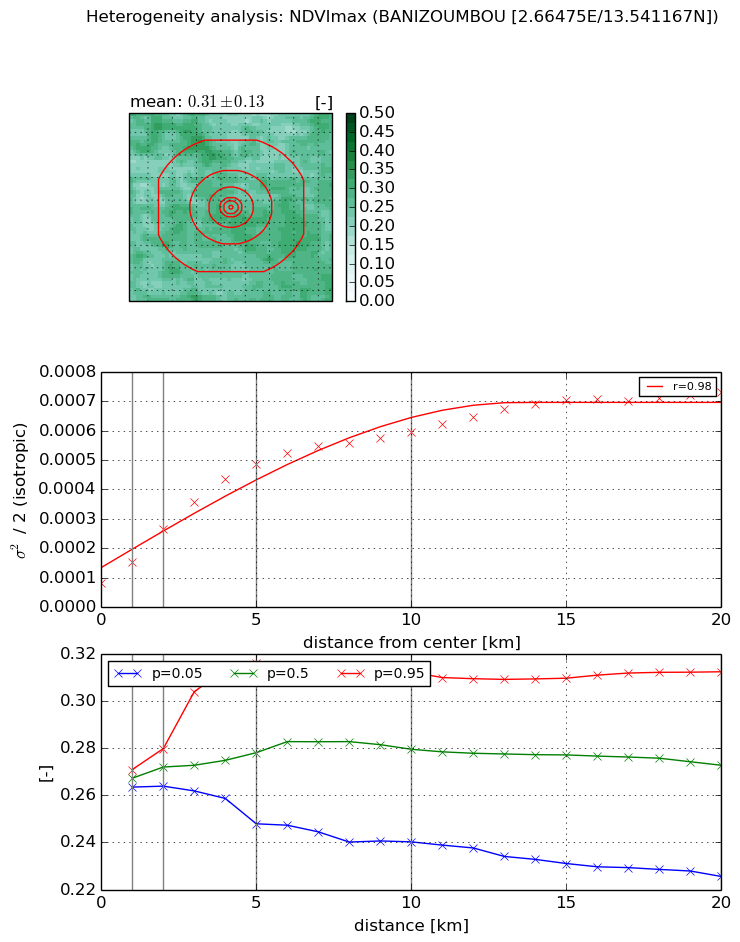
NDVI (max. NDVI composite)


Roman et al. (2009) index


St

2.42893285417

Rcv

0.447707380488

Rse

0.0

Rst

-0.177209610481

Rsv

0.610193314714


NDVI range @ 1km [-]

0.01

NDVI range @ 2km [-]

0.02

NDVI range @ 5km [-]

0.07

NDVI range @ 10km [-]

0.07

NDVI range @ 20km [-]

0.09


Variance slope @ 1 km

7.04594829498e-05

Variance slope @ 2 km

9.08902469331e-05

Variance slope @ 5 km

8.43332419323e-05

Variance slope @ 10 km

5.10038363566e-05

Variance slope @ 20 km

2.80339220337e-05


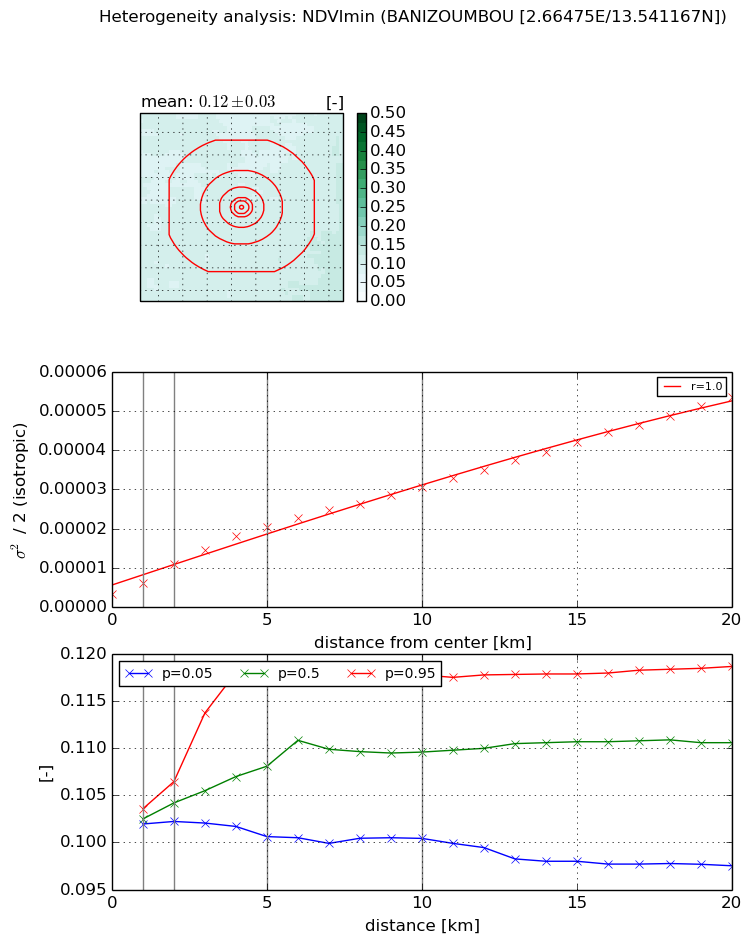
NDVI (min. NDVI composite)I


Roman et al. (2009) index


St

1.74621695496

Rcv

0.482576123373

Rse

0.0

Rst

-0.127585505852

Rsv

1.10783795352


NDVI range @ 1km [-]

0.0

NDVI range @ 2km [-]

0.0

NDVI range @ 5km [-]

0.02

NDVI range @ 10km [-]

0.02

NDVI range @ 20km [-]

0.02


NDVI slope @ 1 km

2.90724651516e-06

NDVI slope @ 2 km

3.79340824012e-06

NDVI slope @ 5 km

3.56862741275e-06

NDVI slope @ 10 km

2.70282032466e-06

NDVI slope @ 20 km

2.37122326367e-06


Temporal stability analysis

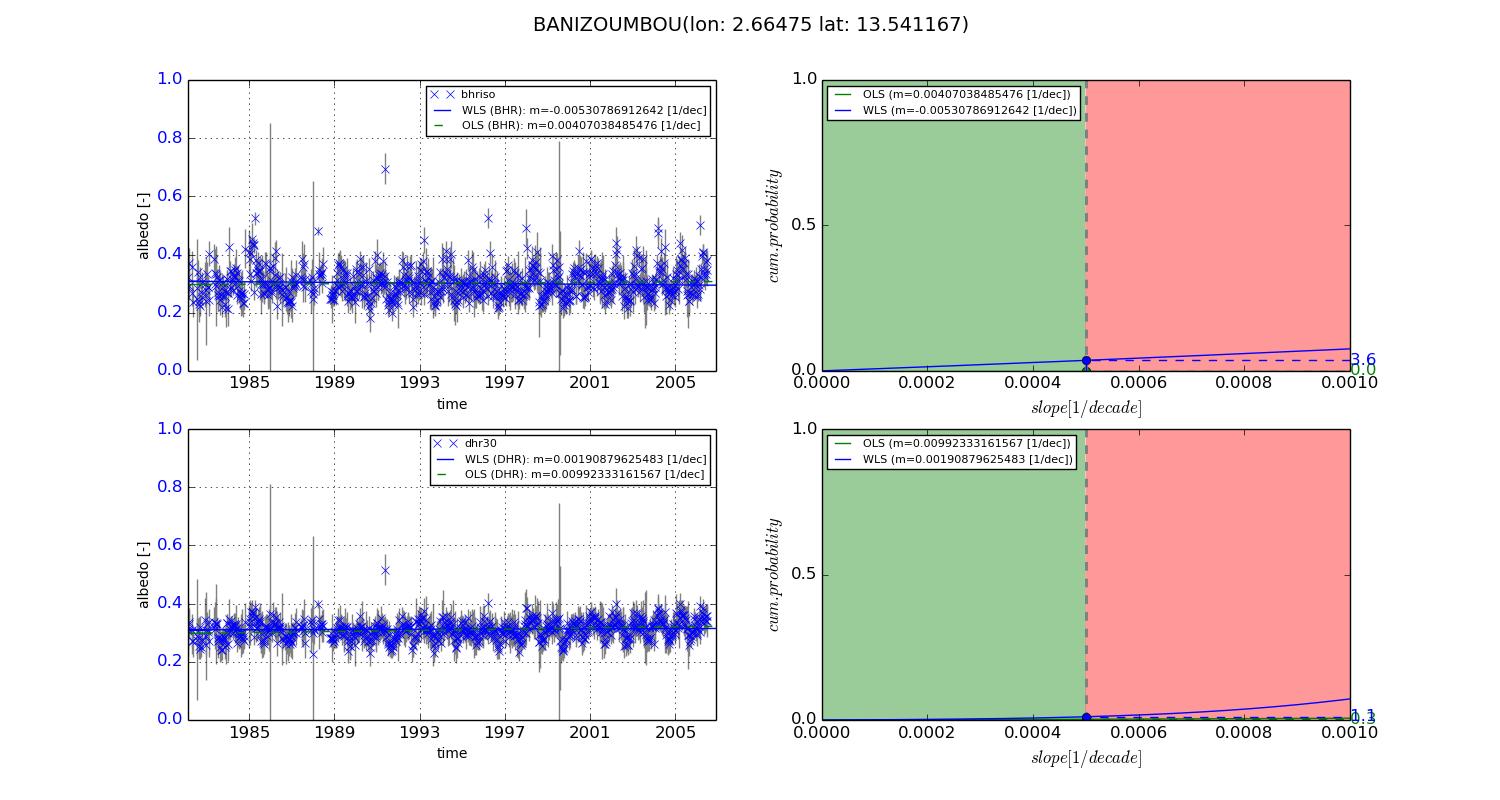
+000 deg (BHR)


BHR statistics

Temporal stability [1/decade]:


abs

rel


Weighted least square:

-0.00530786912642


Ordinary least square:

0.00407038485476


Probabilities that GCOS criteria is met:

Weighted least square:

3.6 %

Ordinary least square:

0.0 %


DHR statistics

Temporal stability [1/decade]:


abs

rel


Weighted least square:

0.00190879625483


Ordinary least square:

0.00992333161567


Probabilities that GCOS criteria is met:

Weighted least square:

1.1 %

Ordinary least square:

0.3 %


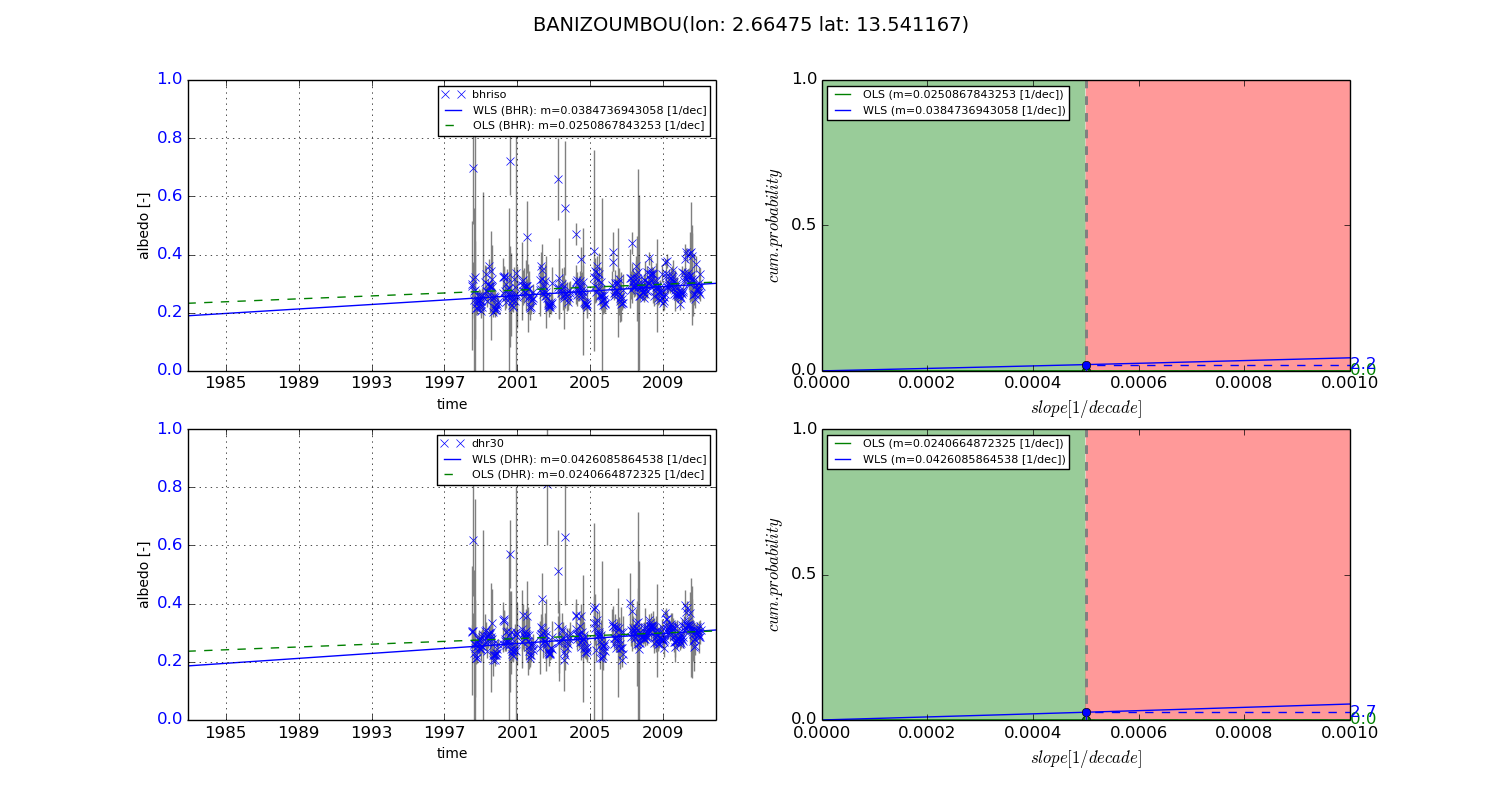
+057/+063 deg (BHR)


BHR statistics

Temporal stability [1/decade]:


abs

rel


Weighted least square:

0.0384736943058


Ordinary least square:

0.0250867843253


Probabilities that GCOS criteria is met:

Weighted least square:

2.2 %

Ordinary least square:

0.0 %


DHR statistics

Temporal stability [1/decade]:


abs

rel


Weighted least square:

0.0426085864538


Ordinary least square:

0.0240664872325


Probabilities that GCOS criteria is met:

Weighted least square:

2.7 %

Ordinary least square:

0.0 %


Temporal anomaly analyis

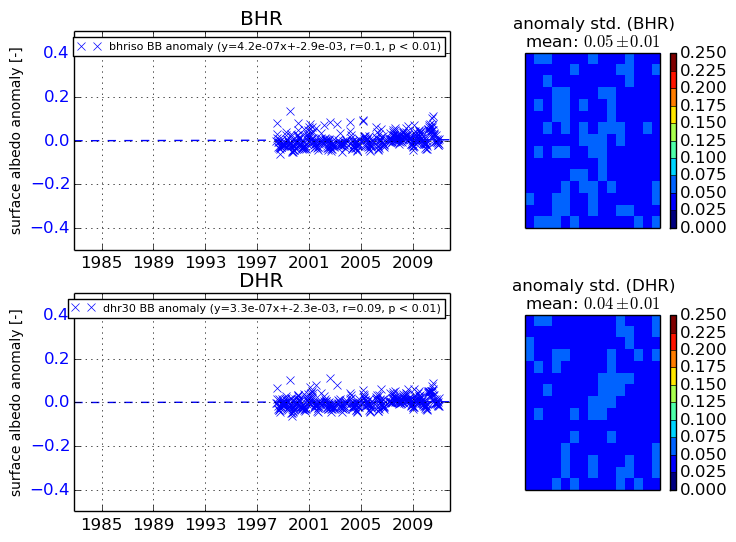
The variance of the temporal anomalies provides an additional measure about the stability of the signal AFTER removal of the mean seasonal cylce.
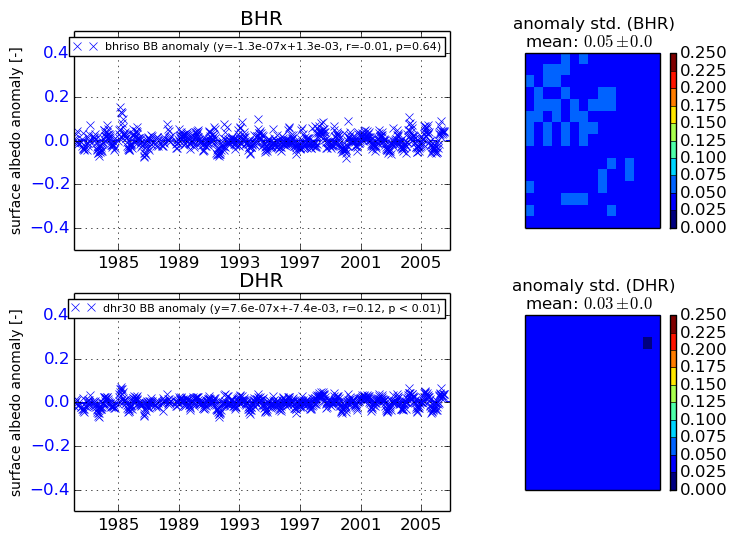
+000 deg


+057/+063 deg