BAREILLY


Location

lon / lat [deg]: 79.437 / 28.39

Source network: AERONET


Geostationary surface albedo (GSA) data


“+000”


“+057/+063”


Landcover information (based on ESA CCI landcover data)


Landcover fractions @ 2km distance


Landcover fractions @ 20 km distance


Legend


Distance to open water bodies [km]:

5.88

Distance to urban areas [km]:

0.06


Radius: 1 km

Number of landcover classes:

1

Dominant landcover type:

190: urban areas

Fraction of dominant landcover type [%]:

100.0


Radius: 2 km

Number of landcover classes:

2

Dominant landcover type:

190: urban areas

Fraction of dominant landcover type [%]:

93.0


Radius: 5 km

Number of landcover classes:

3

Dominant landcover type:

190: urban areas

Fraction of dominant landcover type [%]:

65.0


Radius: 10 km

Number of landcover classes:

4

Dominant landcover type:

20: cropland, irrigated or post-flooded

Fraction of dominant landcover type [%]:

70.0


Radius: 20 km

Number of landcover classes:

4

Dominant landcover type:

20: cropland, irrigated or post-flooded

Fraction of dominant landcover type [%]:

88.0


Disturbances


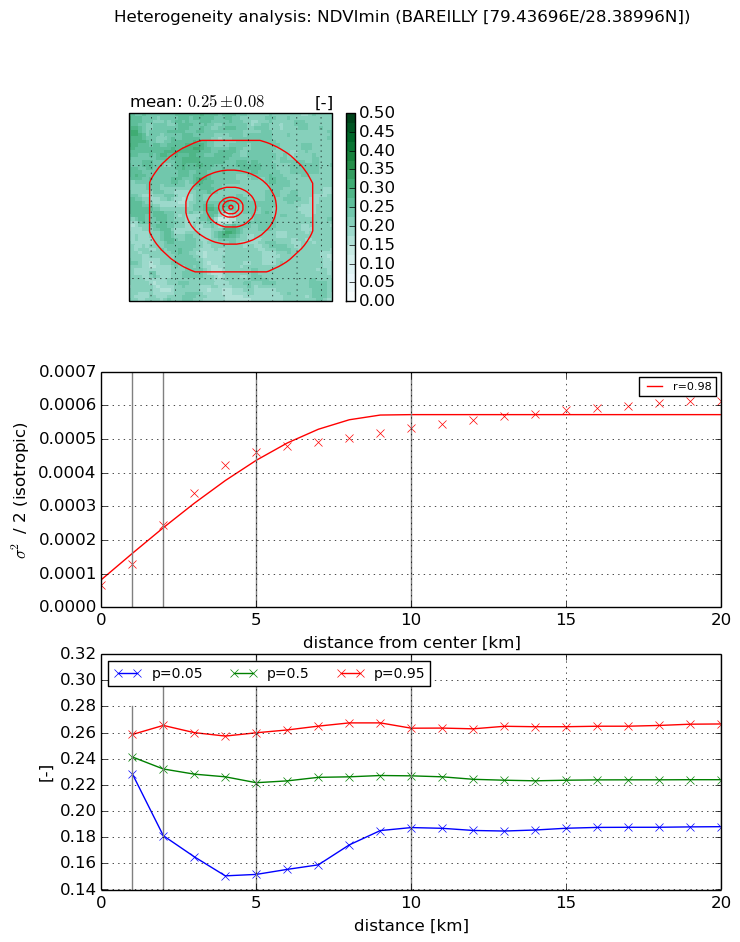
Heterogeneity analysis

The heterogeneity analysis provides information about the spatial and temporal heterogeneity of the site.

Topography


Roman et al. (2009) index


St

16.7768904983

Rcv

0.0528641614758

Rse

0.0

Rst

0.0550036591034

Rsv

-0.0709495830568


Height range @ 1km [m]

8

Height range @ 2km [m]

9

Height range @ 5km [m]

9

Height range @ 10km [m]

-999

Height range @ 20km [m]

-999


Variance slope @ 1 km

4

Variance slope @ 2 km

2

Variance slope @ 5 km

1

Variance slope @ 10 km

-999

Variance slope @ 20 km

-999


NDVI (max. NDVI composite)


Roman et al. (2009) index


St

2.09727435059e-07

Rcv

0.465742390955

Rse

0.0

Rst

0.26869765068

Rsv

14304279.4812


NDVI range @ 1km [-]

0.05

NDVI range @ 2km [-]

0.13

NDVI range @ 5km [-]

0.33

NDVI range @ 10km [-]

0.27

NDVI range @ 20km [-]

0.2


Variance slope @ 1 km

0.000360752005549

Variance slope @ 2 km

0.000540792990544

Variance slope @ 5 km

0.000559017986032

Variance slope @ 10 km

0.000427635895803

Variance slope @ 20 km

0.000269385380547


NDVI (min. NDVI composite)I


Roman et al. (2009) index


St

8.0690336383

Rcv

0.0387473994533

Rse

0.0

Rst

0.131989962258

Rsv

-0.201054371286


NDVI range @ 1km [-]

0.03

NDVI range @ 2km [-]

0.08

NDVI range @ 5km [-]

0.11

NDVI range @ 10km [-]

0.08

NDVI range @ 20km [-]

0.08


NDVI slope @ 1 km

6.19032162642e-05

NDVI slope @ 2 km

8.92561706221e-05

NDVI slope @ 5 km

8.40515230784e-05

NDVI slope @ 10 km

4.56074599789e-05

NDVI slope @ 20 km

2.1996243258e-05


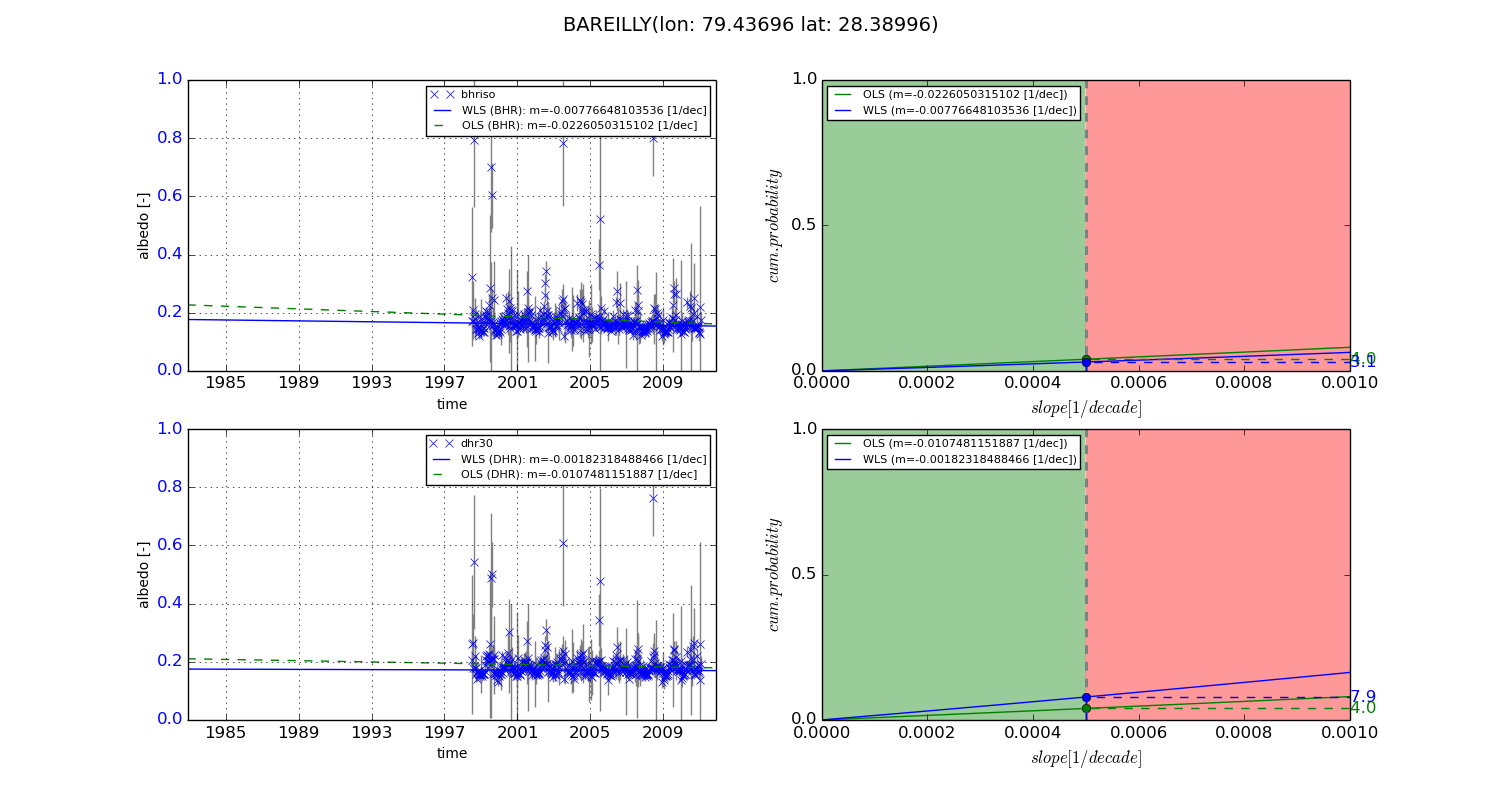
Temporal stability analysis

+000 deg (BHR)


BHR statistics

Temporal stability [1/decade]:


abs

rel


Weighted least square:

-99999.0


Ordinary least square:

-99999.0


Probabilities that GCOS criteria is met:

Weighted least square:

-99999.0 %

Ordinary least square:

-99999.0 %


DHR statistics

Temporal stability [1/decade]:


abs

rel


Weighted least square:

-99999.0


Ordinary least square:

-99999.0


Probabilities that GCOS criteria is met:

Weighted least square:

-99999.0 %

Ordinary least square:

-99999.0 %


+057/+063 deg (BHR)


BHR statistics

Temporal stability [1/decade]:


abs

rel


Weighted least square:

-0.00776648103536


Ordinary least square:

-0.0226050315102


Probabilities that GCOS criteria is met:

Weighted least square:

3.1 %

Ordinary least square:

4.0 %


DHR statistics

Temporal stability [1/decade]:


abs

rel


Weighted least square:

-0.00182318488466


Ordinary least square:

-0.0107481151887


Probabilities that GCOS criteria is met:

Weighted least square:

7.9 %

Ordinary least square:

4.0 %


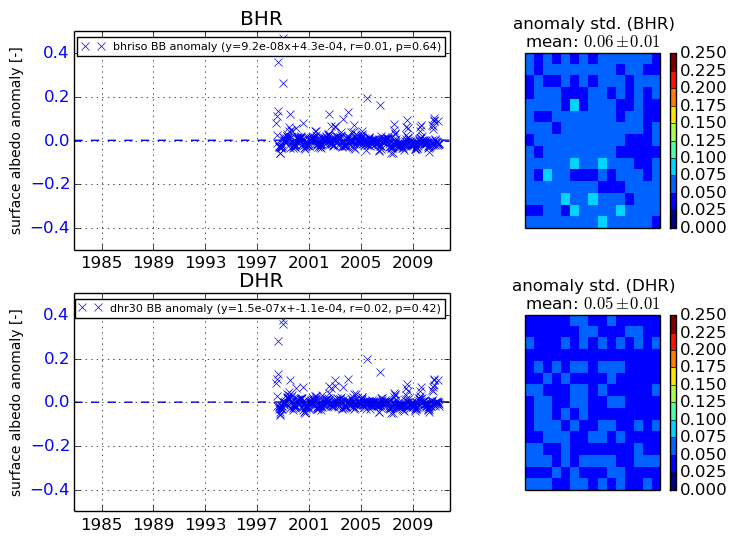
Temporal anomaly analyis

The variance of the temporal anomalies provides an additional measure about the stability of the signal AFTER removal of the mean seasonal cylce.

+000 deg


+057/+063 deg