BARNAUL


Location

lon / lat [deg]: 83.7722 / 53.3417

Source network: AERONET


Geostationary surface albedo (GSA) data


“+000”


“+057/+063”


Landcover information (based on ESA CCI landcover data)


Landcover fractions @ 2km distance


Landcover fractions @ 20 km distance


Legend


Distance to open water bodies [km]:

2.61

Distance to urban areas [km]:

0.18


Radius: 1 km

Number of landcover classes:

1

Dominant landcover type:

190: urban areas

Fraction of dominant landcover type [%]:

100.0


Radius: 2 km

Number of landcover classes:

1

Dominant landcover type:

190: urban areas

Fraction of dominant landcover type [%]:

100.0


Radius: 5 km

Number of landcover classes:

7

Dominant landcover type:

190: urban areas

Fraction of dominant landcover type [%]:

77.0


Radius: 10 km

Number of landcover classes:

10

Dominant landcover type:

190: urban areas

Fraction of dominant landcover type [%]:

44.0


Radius: 20 km

Number of landcover classes:

10

Dominant landcover type:

10: cropland, rainfed

Fraction of dominant landcover type [%]:

39.0


Disturbances


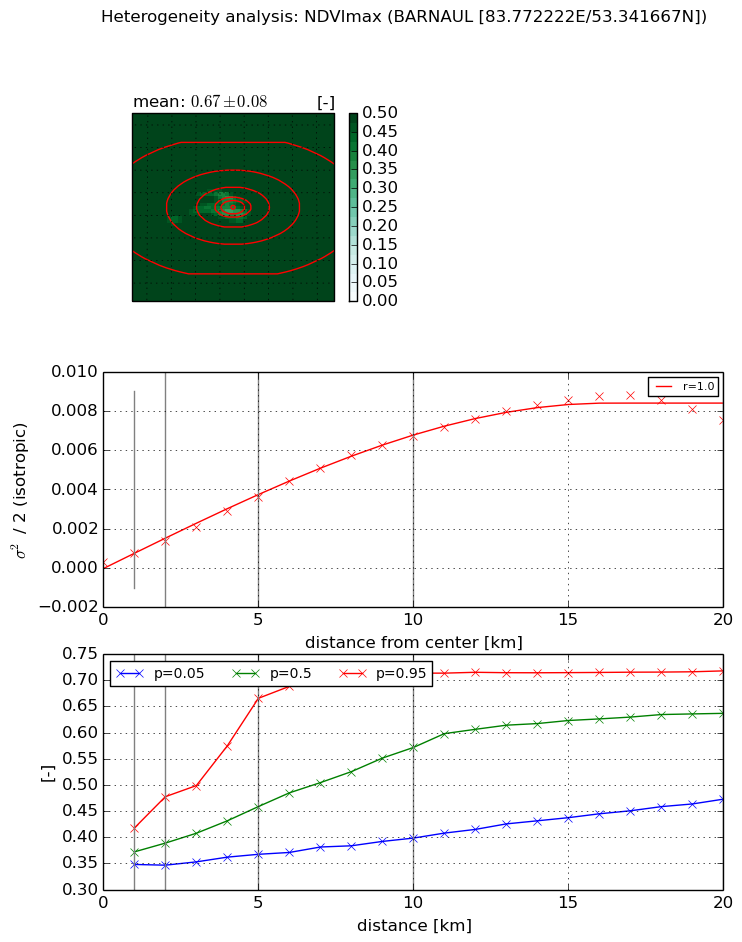
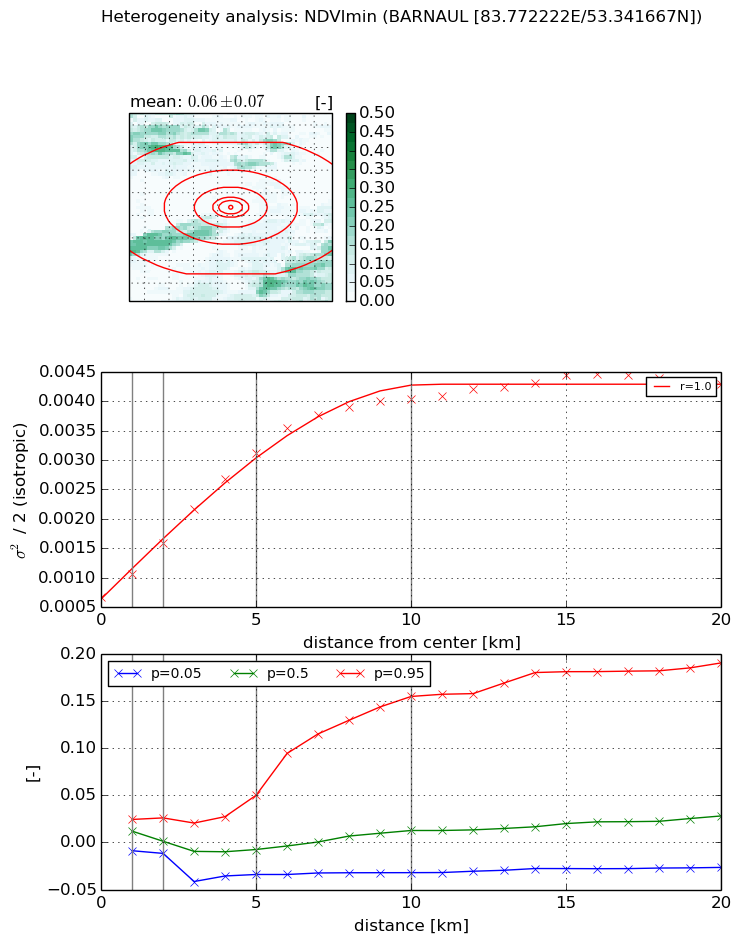
Heterogeneity analysis

The heterogeneity analysis provides information about the spatial and temporal heterogeneity of the site.

Topography


Roman et al. (2009) index


St

3.70763422524

Rcv

0.329366358543

Rse

0.0

Rst

-0.0462212779368

Rsv

-0.433553669741


Height range @ 1km [m]

38

Height range @ 2km [m]

54

Height range @ 5km [m]

85

Height range @ 10km [m]

-999

Height range @ 20km [m]

-999


Variance slope @ 1 km

225

Variance slope @ 2 km

234

Variance slope @ 5 km

182

Variance slope @ 10 km

-999

Variance slope @ 20 km

-999


NDVI (max. NDVI composite)


Roman et al. (2009) index


St

3.30157077628e-08

Rcv

0.627005698361

Rse

0.0

Rst

0.0326199986139

Rsv

90865838.7629


NDVI range @ 1km [-]

0.07

NDVI range @ 2km [-]

0.13

NDVI range @ 5km [-]

0.3

NDVI range @ 10km [-]

0.32

NDVI range @ 20km [-]

0.25


Variance slope @ 1 km

0.000425862248123

Variance slope @ 2 km

0.000534917819311

Variance slope @ 5 km

0.000680390980388

Variance slope @ 10 km

0.000683071972062

Variance slope @ 20 km

0.000430445336346


NDVI (min. NDVI composite)I


Roman et al. (2009) index


St

nan

Rcv

-53.8620394968

Rse

nan

Rst

nan

Rsv

-0.999998954995


NDVI range @ 1km [-]

0.03

NDVI range @ 2km [-]

0.04

NDVI range @ 5km [-]

0.08

NDVI range @ 10km [-]

0.19

NDVI range @ 20km [-]

0.22


NDVI slope @ 1 km

0.000387832917675

NDVI slope @ 2 km

0.000457340966141

NDVI slope @ 5 km

0.000502784173954

NDVI slope @ 10 km

0.000359407158017

NDVI slope @ 20 km

0.000163891910335


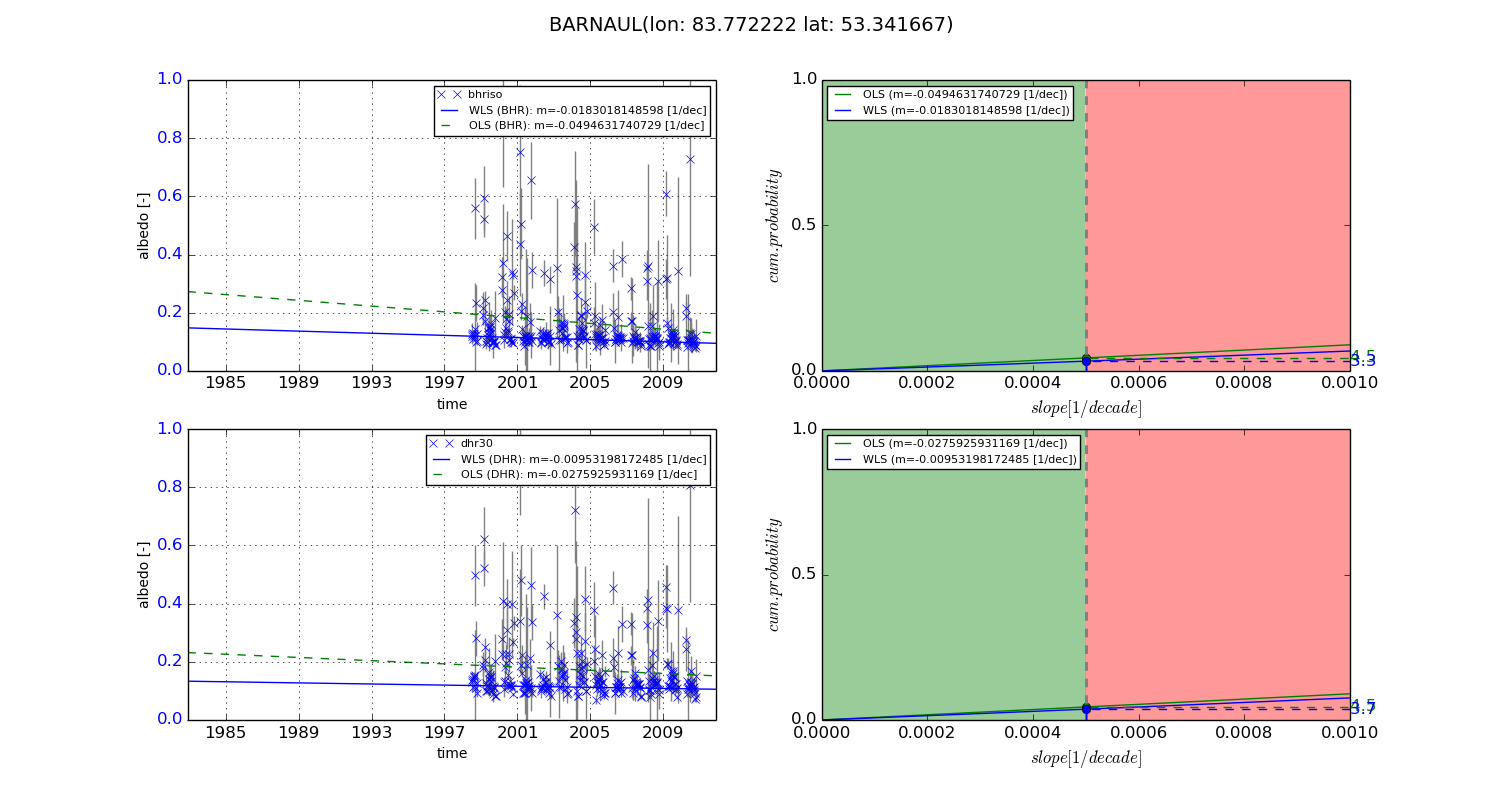
Temporal stability analysis

+000 deg (BHR)


BHR statistics

Temporal stability [1/decade]:


abs

rel


Weighted least square:

None


Ordinary least square:

None


Probabilities that GCOS criteria is met:

Weighted least square:

None %

Ordinary least square:

None %


DHR statistics

Temporal stability [1/decade]:


abs

rel


Weighted least square:

None


Ordinary least square:

None


Probabilities that GCOS criteria is met:

Weighted least square:

None %

Ordinary least square:

None %


+057/+063 deg (BHR)


BHR statistics

Temporal stability [1/decade]:


abs

rel


Weighted least square:

-0.0183018148598


Ordinary least square:

-0.0494631740729


Probabilities that GCOS criteria is met:

Weighted least square:

3.3 %

Ordinary least square:

4.5 %


DHR statistics

Temporal stability [1/decade]:


abs

rel


Weighted least square:

-0.00953198172485


Ordinary least square:

-0.0275925931169


Probabilities that GCOS criteria is met:

Weighted least square:

3.7 %

Ordinary least square:

4.5 %


Temporal anomaly analyis

The variance of the temporal anomalies provides an additional measure about the stability of the signal AFTER removal of the mean seasonal cylce.

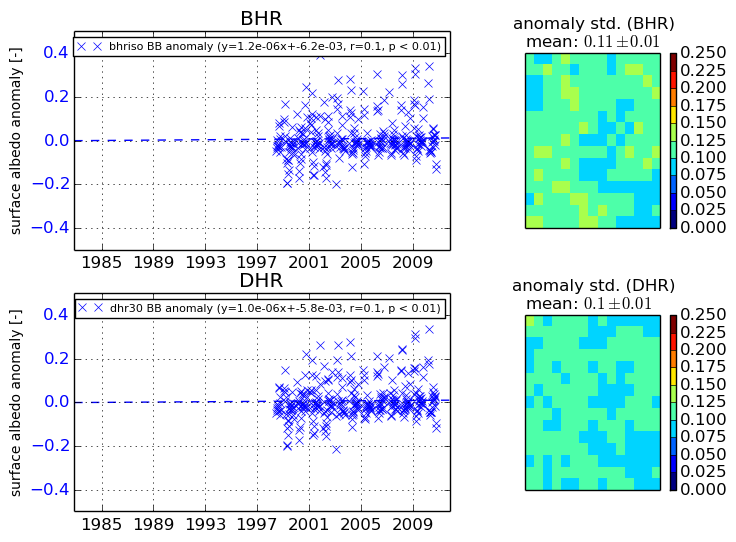
+000 deg


+057/+063 deg