BE-JAL


Location

lon / lat [deg]: 6.0733 / 50.5639

Source network: FLUXNET


Geostationary surface albedo (GSA) data


“+000”


“+057/+063”


Landcover information (based on ESA CCI landcover data)


Landcover fractions @ 2km distance


Landcover fractions @ 20 km distance


Legend


Distance to open water bodies [km]:

5.28

Distance to urban areas [km]:

5.34


Radius: 1 km

Number of landcover classes:

4

Dominant landcover type:

70: Tree cover, needleleaved, evergreen, closed to open (>15%)

Fraction of dominant landcover type [%]:

75.0


Radius: 2 km

Number of landcover classes:

4

Dominant landcover type:

70: Tree cover, needleleaved, evergreen, closed to open (>15%)

Fraction of dominant landcover type [%]:

69.0


Radius: 5 km

Number of landcover classes:

4

Dominant landcover type:

70: Tree cover, needleleaved, evergreen, closed to open (>15%)

Fraction of dominant landcover type [%]:

51.0


Radius: 10 km

Number of landcover classes:

7

Dominant landcover type:

70: Tree cover, needleleaved, evergreen, closed to open (>15%)

Fraction of dominant landcover type [%]:

37.0


Radius: 20 km

Number of landcover classes:

9

Dominant landcover type:

130: grassland

Fraction of dominant landcover type [%]:

30.0


Disturbances


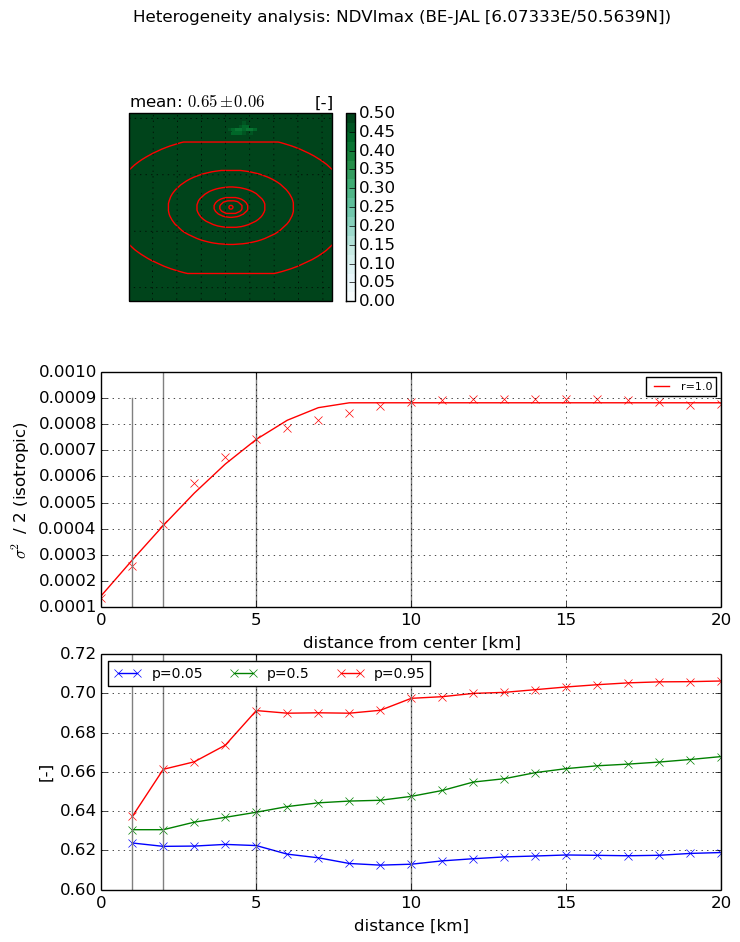
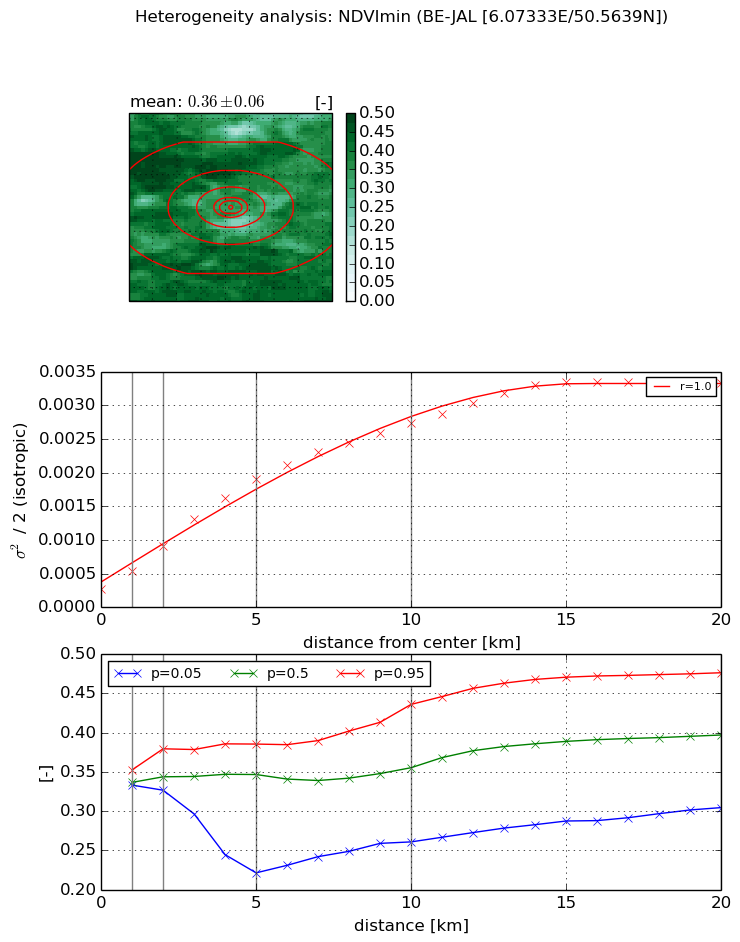
Heterogeneity analysis

The heterogeneity analysis provides information about the spatial and temporal heterogeneity of the site.

Topography


Roman et al. (2009) index


St

2.35215148829

Rcv

0.697934447902

Rse

0.0

Rst

-1.73187214768e-07

Rsv

-0.577493434858


Height range @ 1km [m]

62

Height range @ 2km [m]

108

Height range @ 5km [m]

246

Height range @ 10km [m]

-999

Height range @ 20km [m]

-999


Variance slope @ 1 km

656

Variance slope @ 2 km

767

Variance slope @ 5 km

1207

Variance slope @ 10 km

-999

Variance slope @ 20 km

-999


NDVI (max. NDVI composite)


Roman et al. (2009) index


St

2.69324432594

Rcv

0.56492417964

Rse

0.0

Rst

0.220733722198

Rsv

0.328240295628


NDVI range @ 1km [-]

0.01

NDVI range @ 2km [-]

0.04

NDVI range @ 5km [-]

0.07

NDVI range @ 10km [-]

0.08

NDVI range @ 20km [-]

0.09


Variance slope @ 1 km

0.000121610053142

Variance slope @ 2 km

0.000140909713982

Variance slope @ 5 km

0.000126867767565

Variance slope @ 10 km

7.31703375552e-05

Variance slope @ 20 km

2.83932348866e-05


NDVI (min. NDVI composite)I


Roman et al. (2009) index


St

5.18156586e-07

Rcv

0.961106530054

Rse

0.0

Rst

0.0859233902075

Rsv

5789754.56171


NDVI range @ 1km [-]

0.02

NDVI range @ 2km [-]

0.05

NDVI range @ 5km [-]

0.16

NDVI range @ 10km [-]

0.18

NDVI range @ 20km [-]

0.17


NDVI slope @ 1 km

0.000262698082973

NDVI slope @ 2 km

0.00032038847167

NDVI slope @ 5 km

0.000339400549521

NDVI slope @ 10 km

0.000251371762121

NDVI slope @ 20 km

0.000150737593696


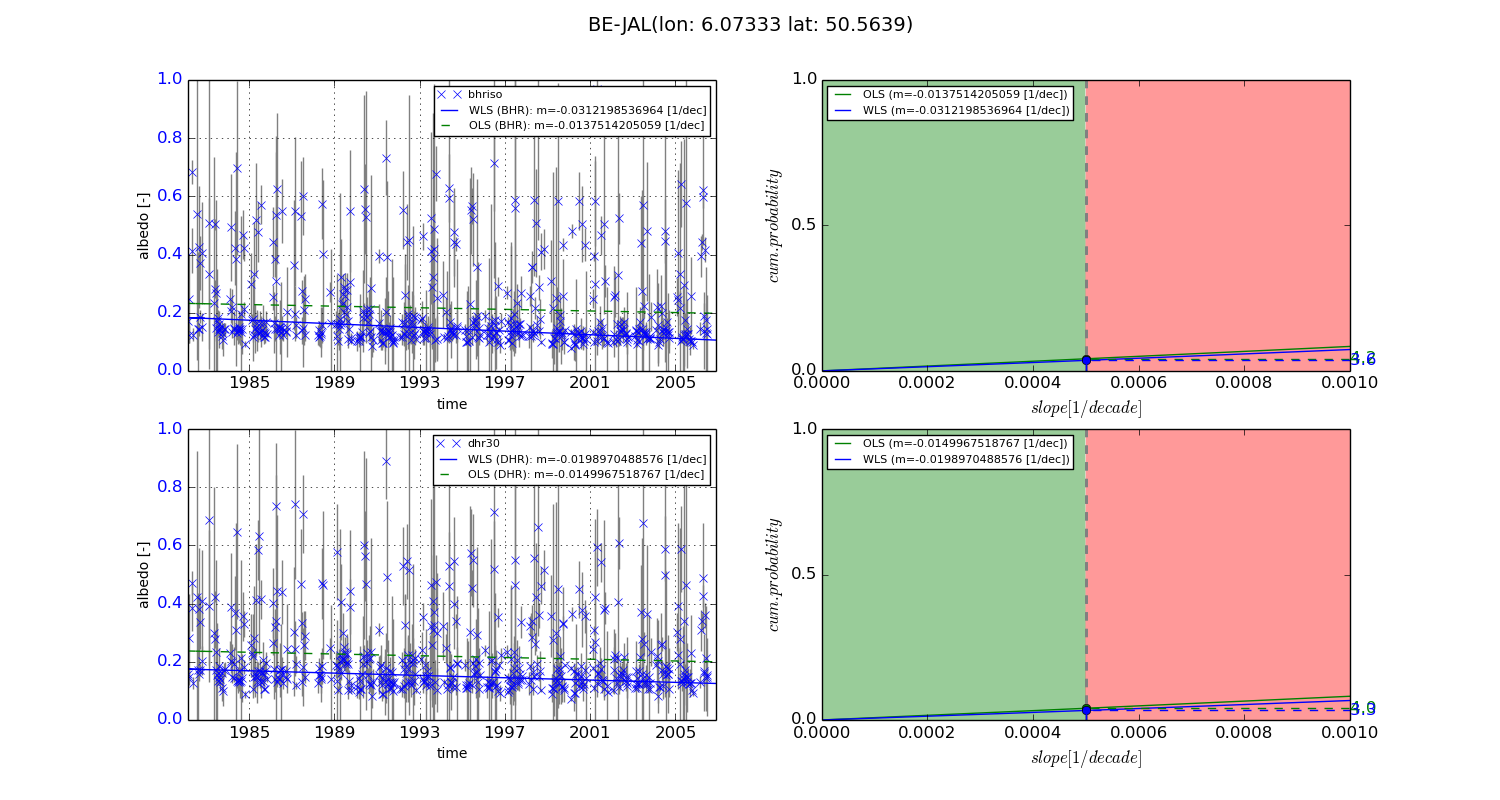
Temporal stability analysis

+000 deg (BHR)


BHR statistics

Temporal stability [1/decade]:


abs

rel


Weighted least square:

-0.0312198536964


Ordinary least square:

-0.0137514205059


Probabilities that GCOS criteria is met:

Weighted least square:

3.6 %

Ordinary least square:

4.2 %


DHR statistics

Temporal stability [1/decade]:


abs

rel


Weighted least square:

-0.0198970488576


Ordinary least square:

-0.0149967518767


Probabilities that GCOS criteria is met:

Weighted least square:

3.3 %

Ordinary least square:

4.0 %


+057/+063 deg (BHR)


BHR statistics

Temporal stability [1/decade]:


abs

rel


Weighted least square:

-99999.0


Ordinary least square:

-99999.0


Probabilities that GCOS criteria is met:

Weighted least square:

-99999.0 %

Ordinary least square:

-99999.0 %


DHR statistics

Temporal stability [1/decade]:


abs

rel


Weighted least square:

-99999.0


Ordinary least square:

-99999.0


Probabilities that GCOS criteria is met:

Weighted least square:

-99999.0 %

Ordinary least square:

-99999.0 %


Temporal anomaly analyis

The variance of the temporal anomalies provides an additional measure about the stability of the signal AFTER removal of the mean seasonal cylce.
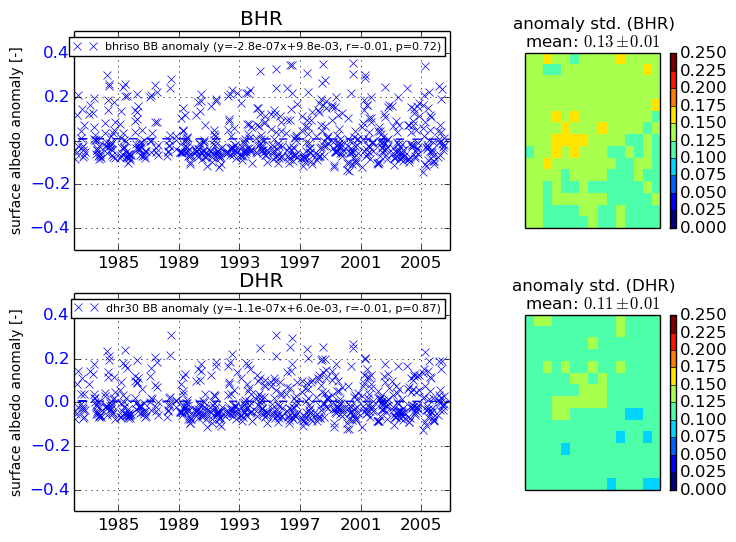
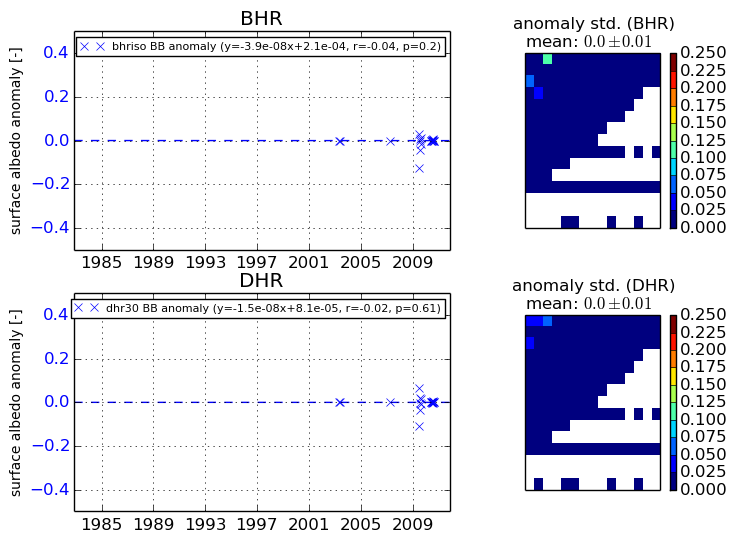
+000 deg


+057/+063 deg