BE-LON


Location

lon / lat [deg]: 4.7449 / 50.5522

Source network: FLUXNET


Geostationary surface albedo (GSA) data


“+000”


“+057/+063”


Landcover information (based on ESA CCI landcover data)


Landcover fractions @ 2km distance


Landcover fractions @ 20 km distance


Legend


Distance to open water bodies [km]:

16.06

Distance to urban areas [km]:

0.62


Radius: 1 km

Number of landcover classes:

2

Dominant landcover type:

10: cropland, rainfed

Fraction of dominant landcover type [%]:

90.0


Radius: 2 km

Number of landcover classes:

2

Dominant landcover type:

10: cropland, rainfed

Fraction of dominant landcover type [%]:

84.0


Radius: 5 km

Number of landcover classes:

4

Dominant landcover type:

10: cropland, rainfed

Fraction of dominant landcover type [%]:

69.0


Radius: 10 km

Number of landcover classes:

4

Dominant landcover type:

10: cropland, rainfed

Fraction of dominant landcover type [%]:

76.0


Radius: 20 km

Number of landcover classes:

5

Dominant landcover type:

10: cropland, rainfed

Fraction of dominant landcover type [%]:

63.0


Disturbances


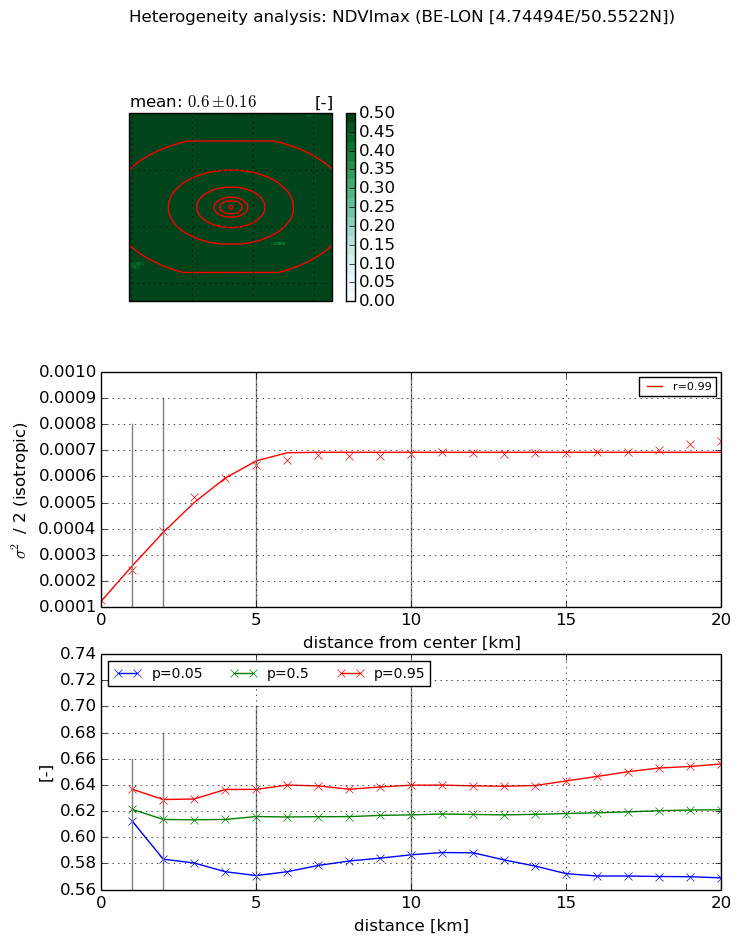
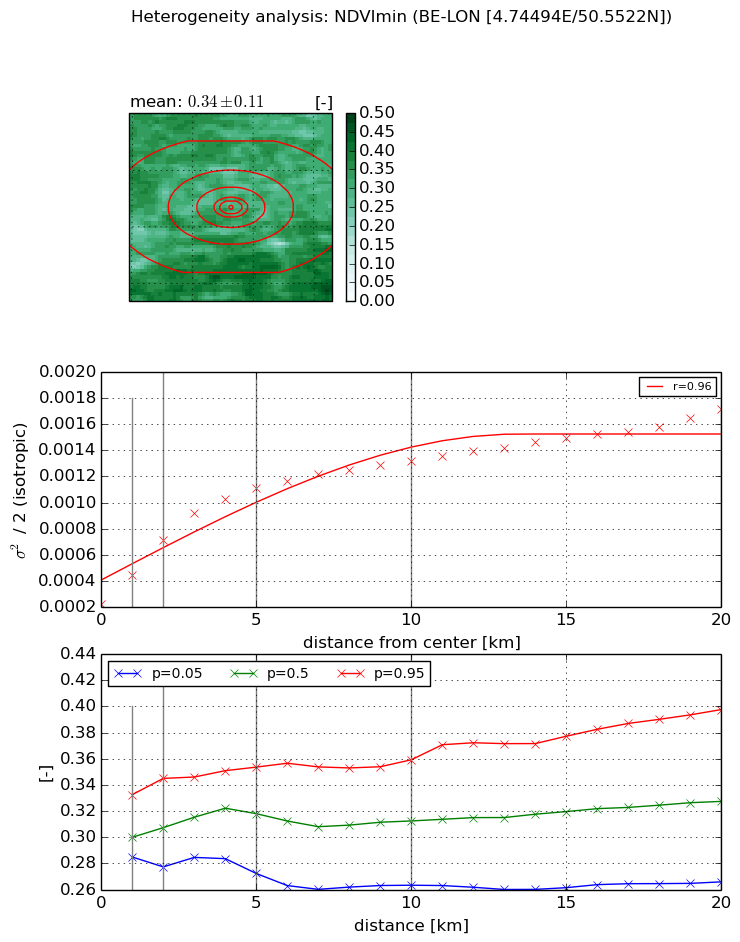
Heterogeneity analysis

The heterogeneity analysis provides information about the spatial and temporal heterogeneity of the site.

Topography


Roman et al. (2009) index


St

0.00301311564019

Rcv

0.328532327346

Rse

0.0

Rst

-1.06313005149e-07

Rsv

995.318617641


Height range @ 1km [m]

21

Height range @ 2km [m]

25

Height range @ 5km [m]

39

Height range @ 10km [m]

-999

Height range @ 20km [m]

-999


Variance slope @ 1 km

55

Variance slope @ 2 km

35

Variance slope @ 5 km

24

Variance slope @ 10 km

-999

Variance slope @ 20 km

-999


NDVI (max. NDVI composite)


Roman et al. (2009) index


St

2.50905817851

Rcv

0.335257570108

Rse

0.0

Rst

-0.1892684008

Rsv

0.671141800246


NDVI range @ 1km [-]

0.02

NDVI range @ 2km [-]

0.05

NDVI range @ 5km [-]

0.07

NDVI range @ 10km [-]

0.05

NDVI range @ 20km [-]

0.09


Variance slope @ 1 km

0.000117244658459

Variance slope @ 2 km

0.000132008768672

Variance slope @ 5 km

0.000107895071422

Variance slope @ 10 km

5.26431897672e-05

Variance slope @ 20 km

1.96112186798e-05


NDVI (min. NDVI composite)I


Roman et al. (2009) index


St

1.79711734963

Rcv

0.244355348964

Rse

0.0

Rst

-0.424985074722

Rsv

-0.99999964507


NDVI range @ 1km [-]

0.05

NDVI range @ 2km [-]

0.07

NDVI range @ 5km [-]

0.08

NDVI range @ 10km [-]

0.1

NDVI range @ 20km [-]

0.13


NDVI slope @ 1 km

0.000224293180643

NDVI slope @ 2 km

0.000244678987989

NDVI slope @ 5 km

0.000183605123162

NDVI slope @ 10 km

0.000101938395378

NDVI slope @ 20 km

5.71746317658e-05


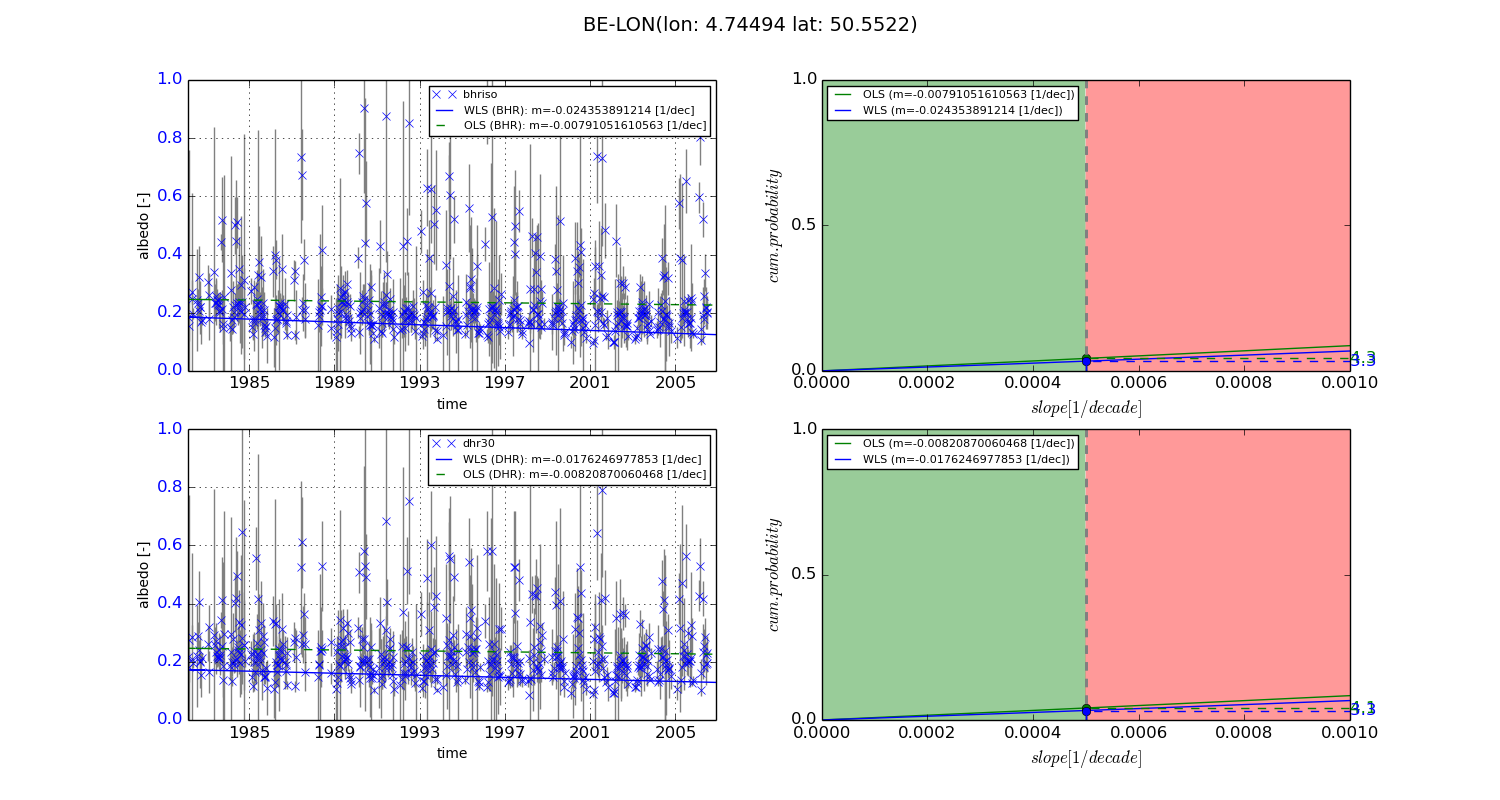
Temporal stability analysis

+000 deg (BHR)


BHR statistics

Temporal stability [1/decade]:


abs

rel


Weighted least square:

-0.024353891214


Ordinary least square:

-0.00791051610563


Probabilities that GCOS criteria is met:

Weighted least square:

3.3 %

Ordinary least square:

4.3 %


DHR statistics

Temporal stability [1/decade]:


abs

rel


Weighted least square:

-0.0176246977853


Ordinary least square:

-0.00820870060468


Probabilities that GCOS criteria is met:

Weighted least square:

3.3 %

Ordinary least square:

4.1 %


+057/+063 deg (BHR)


BHR statistics

Temporal stability [1/decade]:


abs

rel


Weighted least square:

-99999.0


Ordinary least square:

-99999.0


Probabilities that GCOS criteria is met:

Weighted least square:

-99999.0 %

Ordinary least square:

-99999.0 %


DHR statistics

Temporal stability [1/decade]:


abs

rel


Weighted least square:

-99999.0


Ordinary least square:

-99999.0


Probabilities that GCOS criteria is met:

Weighted least square:

-99999.0 %

Ordinary least square:

-99999.0 %


Temporal anomaly analyis

The variance of the temporal anomalies provides an additional measure about the stability of the signal AFTER removal of the mean seasonal cylce.
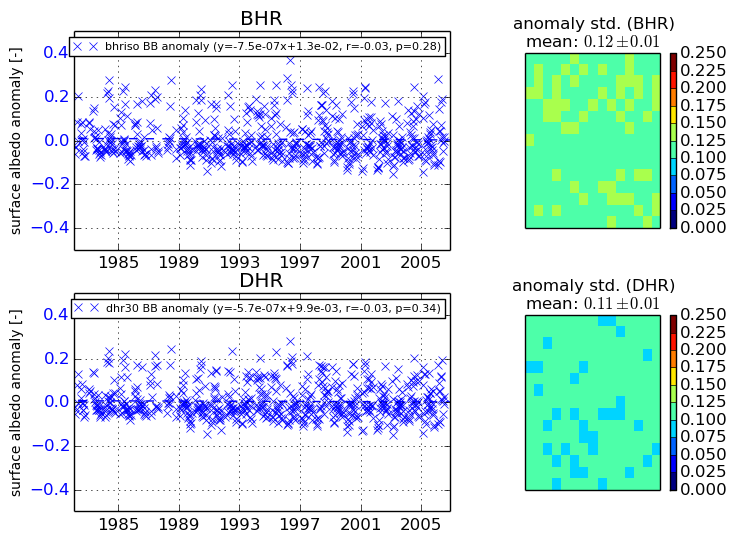
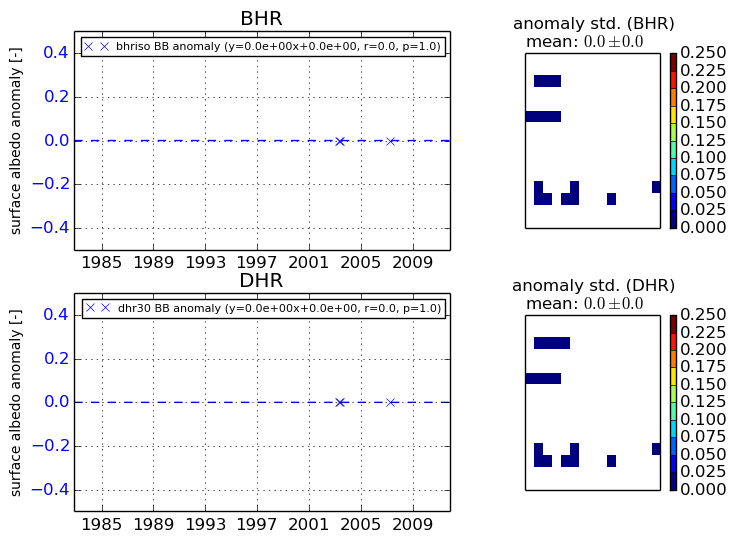
+000 deg


+057/+063 deg