BEIJING_02002


Location

lon / lat [deg]: 116.2833 / 39.9333

Source network: AERONET


Geostationary surface albedo (GSA) data


“+000”


“+057/+063”


Landcover information (based on ESA CCI landcover data)


Landcover fractions @ 2km distance


Landcover fractions @ 20 km distance


Legend


Distance to open water bodies [km]:

2.85

Distance to urban areas [km]:

0.19


Radius: 1 km

Number of landcover classes:

1

Dominant landcover type:

190: urban areas

Fraction of dominant landcover type [%]:

100.0


Radius: 2 km

Number of landcover classes:

1

Dominant landcover type:

190: urban areas

Fraction of dominant landcover type [%]:

100.0


Radius: 5 km

Number of landcover classes:

1

Dominant landcover type:

190: urban areas

Fraction of dominant landcover type [%]:

99.0


Radius: 10 km

Number of landcover classes:

4

Dominant landcover type:

190: urban areas

Fraction of dominant landcover type [%]:

91.0


Radius: 20 km

Number of landcover classes:

8

Dominant landcover type:

190: urban areas

Fraction of dominant landcover type [%]:

70.0


Disturbances


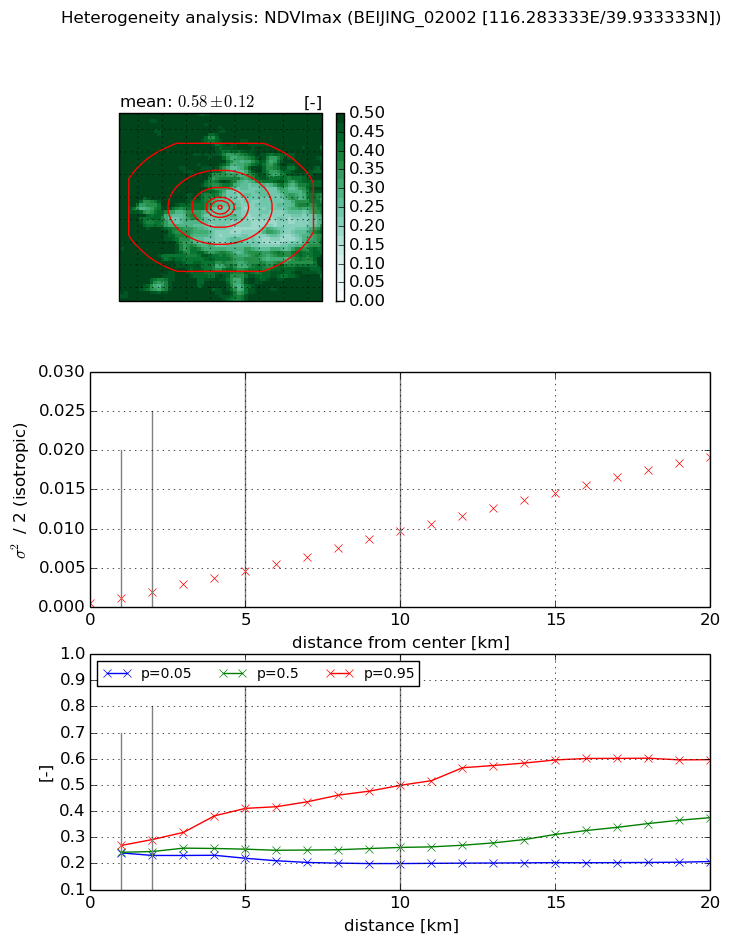
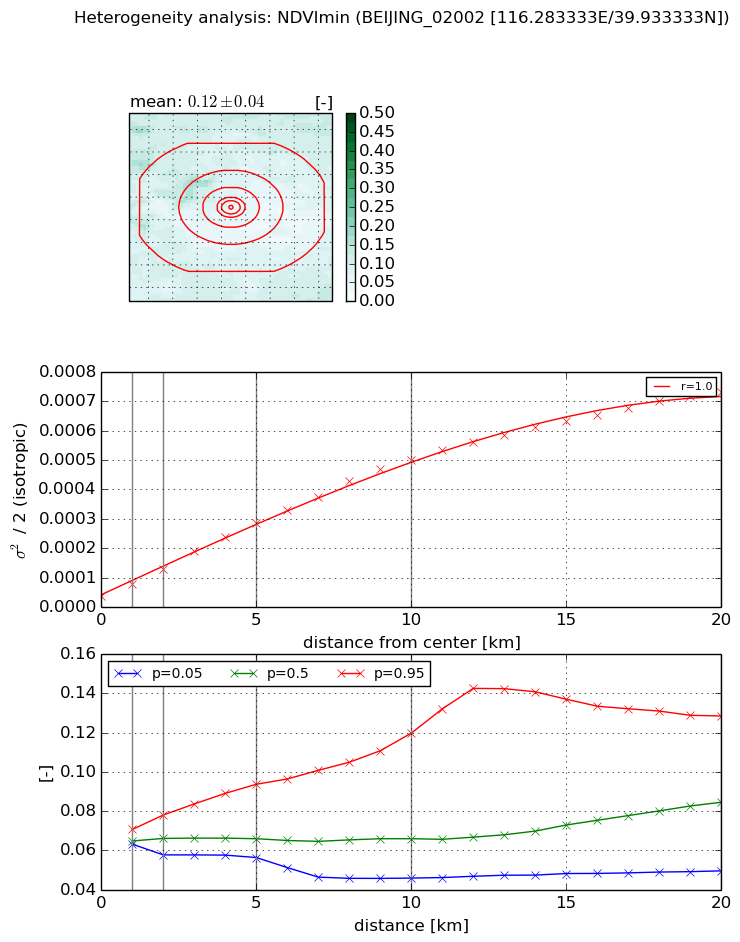
Heterogeneity analysis

The heterogeneity analysis provides information about the spatial and temporal heterogeneity of the site.

Topography


Roman et al. (2009) index


St

2.18132037456

Rcv

0.49708425868

Rse

0.0

Rst

-1.28319470623e-08

Rsv

-0.878229522366


Height range @ 1km [m]

7

Height range @ 2km [m]

8

Height range @ 5km [m]

14

Height range @ 10km [m]

-999

Height range @ 20km [m]

-999


Variance slope @ 1 km

9

Variance slope @ 2 km

5

Variance slope @ 5 km

3

Variance slope @ 10 km

-999

Variance slope @ 20 km

-999


NDVI (max. NDVI composite)


Roman et al. (2009) index


St

1.46131989906

Rcv

0.875647328878

Rse

0.0

Rst

-0.17729131233

Rsv

-0.999999939814


NDVI range @ 1km [-]

0.03

NDVI range @ 2km [-]

0.06

NDVI range @ 5km [-]

0.19

NDVI range @ 10km [-]

0.3

NDVI range @ 20km [-]

0.39


Variance slope @ 1 km

0.000632881339866

Variance slope @ 2 km

0.000704926440278

Variance slope @ 5 km

0.000836934646691

Variance slope @ 10 km

0.000918445066534

Variance slope @ 20 km

0.00096264645467


NDVI (min. NDVI composite)I


Roman et al. (2009) index


St

1.74169736117

Rcv

0.535089470935

Rse

0.0

Rst

-0.187368313705

Rsv

-0.999999897666


NDVI range @ 1km [-]

0.01

NDVI range @ 2km [-]

0.02

NDVI range @ 5km [-]

0.04

NDVI range @ 10km [-]

0.07

NDVI range @ 20km [-]

0.08


NDVI slope @ 1 km

4.2174311388e-05

NDVI slope @ 2 km

4.60786382867e-05

NDVI slope @ 5 km

5.07718662063e-05

NDVI slope @ 10 km

4.75888960562e-05

NDVI slope @ 20 km

3.49938723622e-05


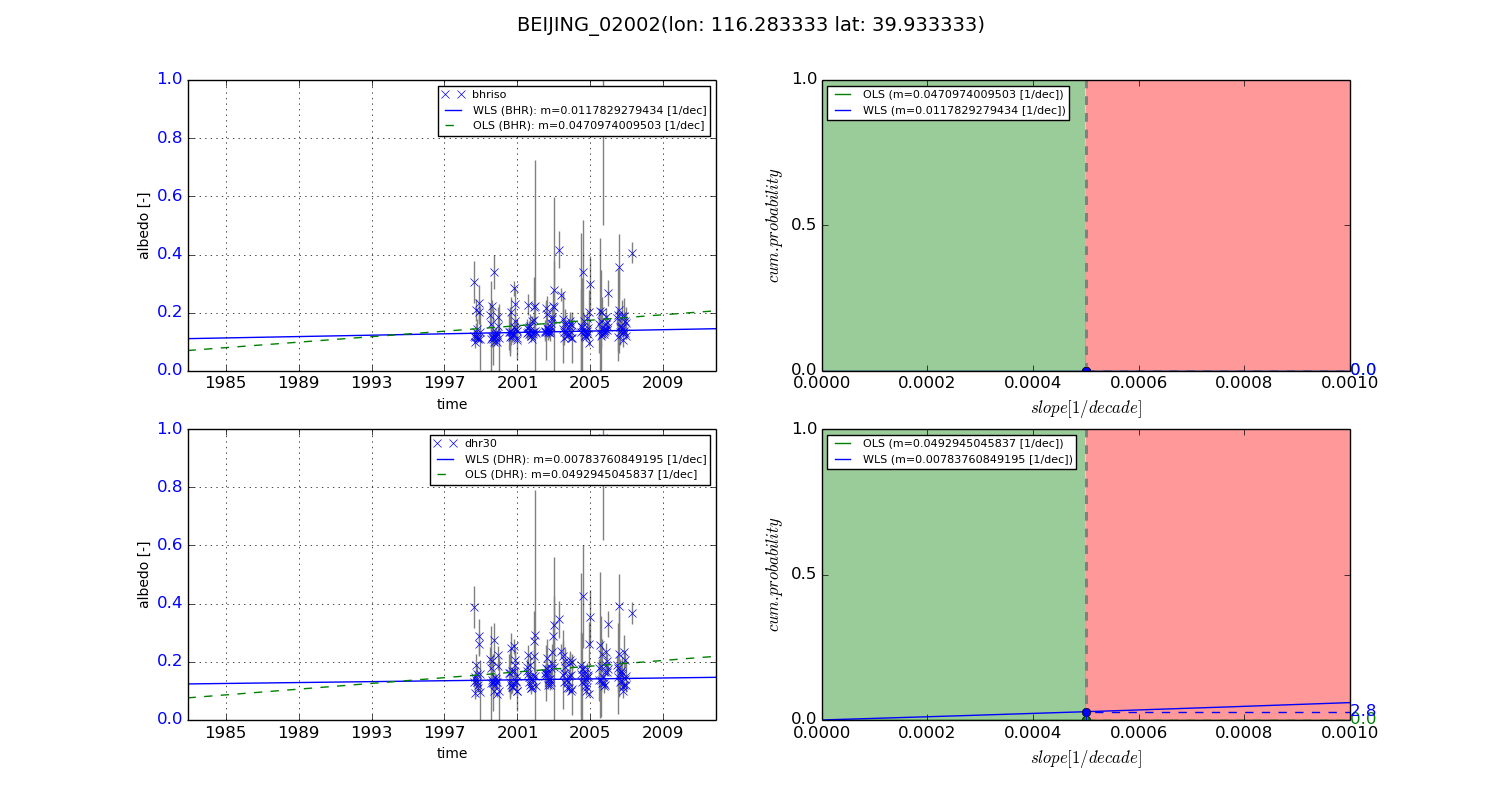
Temporal stability analysis

+000 deg (BHR)


BHR statistics

Temporal stability [1/decade]:


abs

rel


Weighted least square:

None


Ordinary least square:

None


Probabilities that GCOS criteria is met:

Weighted least square:

None %

Ordinary least square:

None %


DHR statistics

Temporal stability [1/decade]:


abs

rel


Weighted least square:

None


Ordinary least square:

None


Probabilities that GCOS criteria is met:

Weighted least square:

None %

Ordinary least square:

None %


+057/+063 deg (BHR)


BHR statistics

Temporal stability [1/decade]:


abs

rel


Weighted least square:

0.0117829279434


Ordinary least square:

0.0470974009503


Probabilities that GCOS criteria is met:

Weighted least square:

0.0 %

Ordinary least square:

0.0 %


DHR statistics

Temporal stability [1/decade]:


abs

rel


Weighted least square:

0.00783760849195


Ordinary least square:

0.0492945045837


Probabilities that GCOS criteria is met:

Weighted least square:

2.8 %

Ordinary least square:

0.0 %


Temporal anomaly analyis

The variance of the temporal anomalies provides an additional measure about the stability of the signal AFTER removal of the mean seasonal cylce.

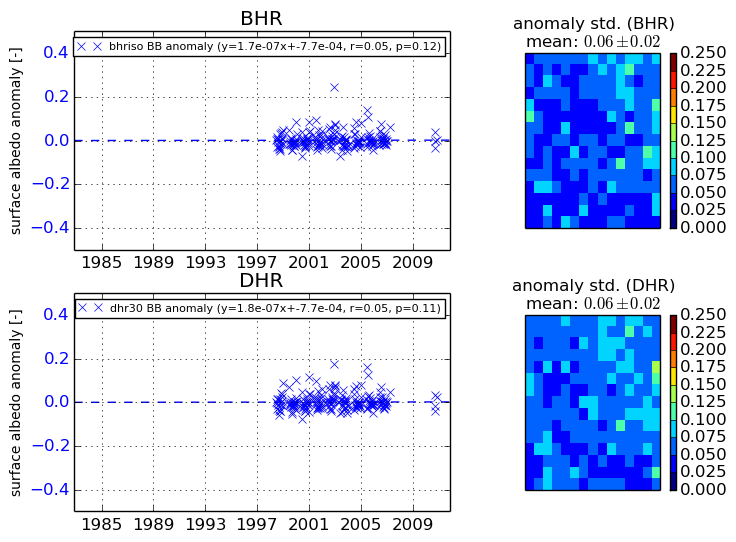
+000 deg


+057/+063 deg