BEIJING


Location

lon / lat [deg]: 116.3814 / 39.9769

Source network: AERONET


Geostationary surface albedo (GSA) data


“+000”


“+057/+063”


Landcover information (based on ESA CCI landcover data)


Landcover fractions @ 2km distance


Landcover fractions @ 20 km distance


Legend


Distance to open water bodies [km]:

7.82

Distance to urban areas [km]:

0.07


Radius: 1 km

Number of landcover classes:

1

Dominant landcover type:

190: urban areas

Fraction of dominant landcover type [%]:

100.0


Radius: 2 km

Number of landcover classes:

1

Dominant landcover type:

190: urban areas

Fraction of dominant landcover type [%]:

100.0


Radius: 5 km

Number of landcover classes:

1

Dominant landcover type:

190: urban areas

Fraction of dominant landcover type [%]:

100.0


Radius: 10 km

Number of landcover classes:

2

Dominant landcover type:

190: urban areas

Fraction of dominant landcover type [%]:

97.0


Radius: 20 km

Number of landcover classes:

7

Dominant landcover type:

190: urban areas

Fraction of dominant landcover type [%]:

74.0


Disturbances


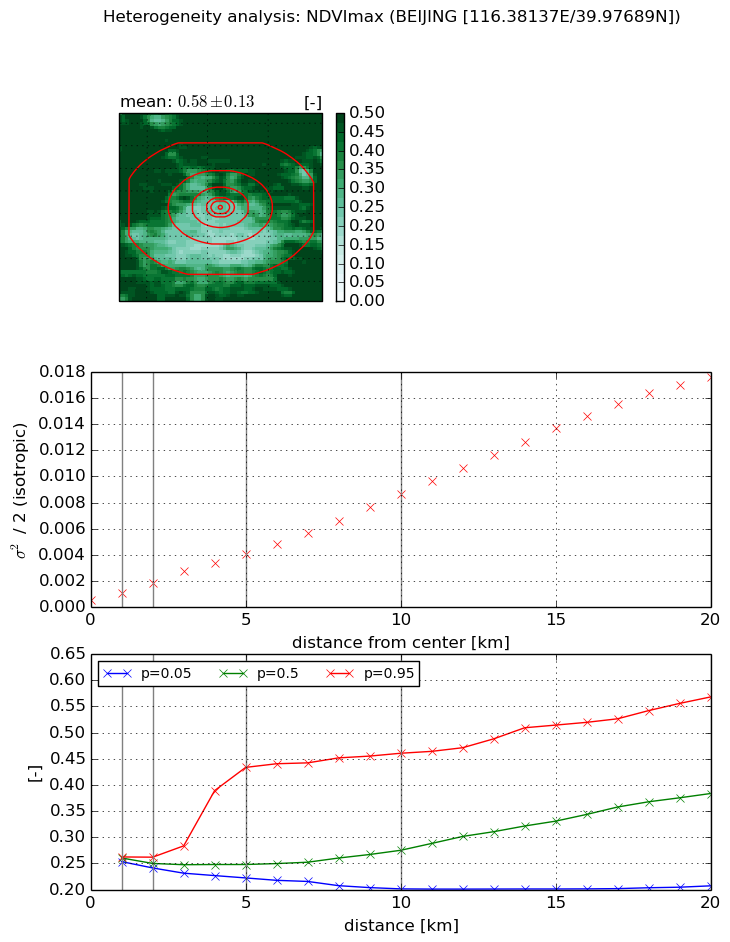
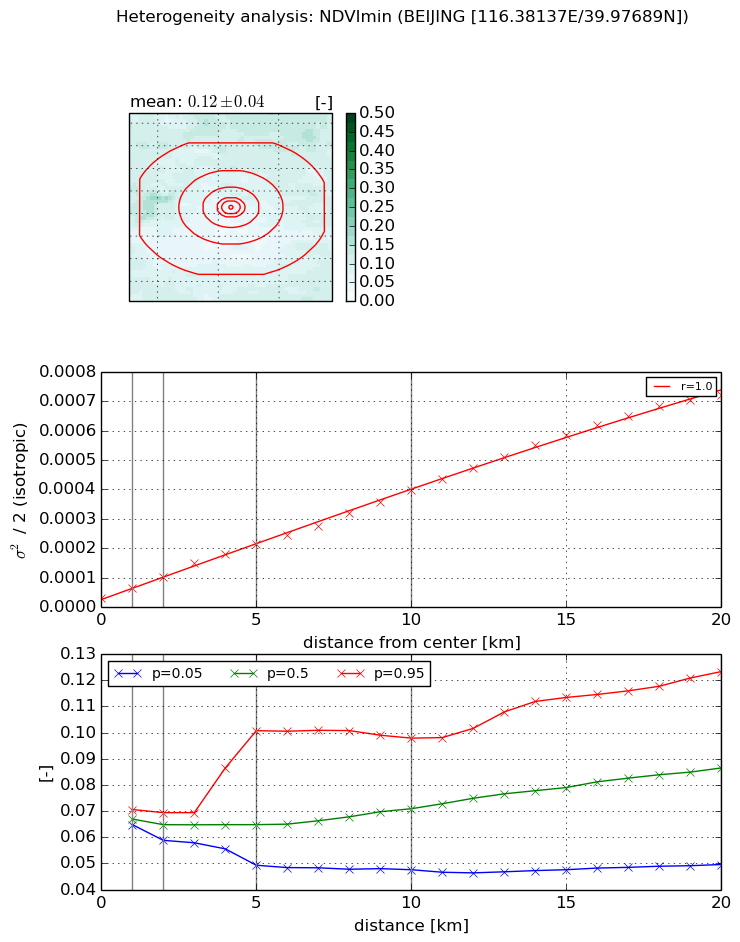
Heterogeneity analysis

The heterogeneity analysis provides information about the spatial and temporal heterogeneity of the site.

Topography


Roman et al. (2009) index


St

1.84451187003

Rcv

0.211123914259

Rse

0.0

Rst

0.415323761865

Rsv

-0.999998891522


Height range @ 1km [m]

12

Height range @ 2km [m]

12

Height range @ 5km [m]

14

Height range @ 10km [m]

-999

Height range @ 20km [m]

-999


Variance slope @ 1 km

5

Variance slope @ 2 km

3

Variance slope @ 5 km

3

Variance slope @ 10 km

-999

Variance slope @ 20 km

-999


NDVI (max. NDVI composite)


Roman et al. (2009) index


St

0.759338957466

Rcv

3.1220435866

Rse

0.0

Rst

-3.11686141824e-08

Rsv

-0.828761184886


NDVI range @ 1km [-]

0.01

NDVI range @ 2km [-]

0.02

NDVI range @ 5km [-]

0.21

NDVI range @ 10km [-]

0.26

NDVI range @ 20km [-]

0.36


Variance slope @ 1 km

0.000590814817332

Variance slope @ 2 km

0.000655114051116

Variance slope @ 5 km

0.000734511632236

Variance slope @ 10 km

0.000800534438945

Variance slope @ 20 km

0.000901086573242


NDVI (min. NDVI composite)I


Roman et al. (2009) index


St

1.0762698631

Rcv

2.74265329917

Rse

0.0

Rst

3.54491988877e-10

Rsv

0.0447517025546


NDVI range @ 1km [-]

0.01

NDVI range @ 2km [-]

0.01

NDVI range @ 5km [-]

0.05

NDVI range @ 10km [-]

0.05

NDVI range @ 20km [-]

0.07


NDVI slope @ 1 km

3.32109828044e-05

NDVI slope @ 2 km

3.6146879475e-05

NDVI slope @ 5 km

3.74544527827e-05

NDVI slope @ 10 km

3.60549960126e-05

NDVI slope @ 20 km

3.58688523478e-05


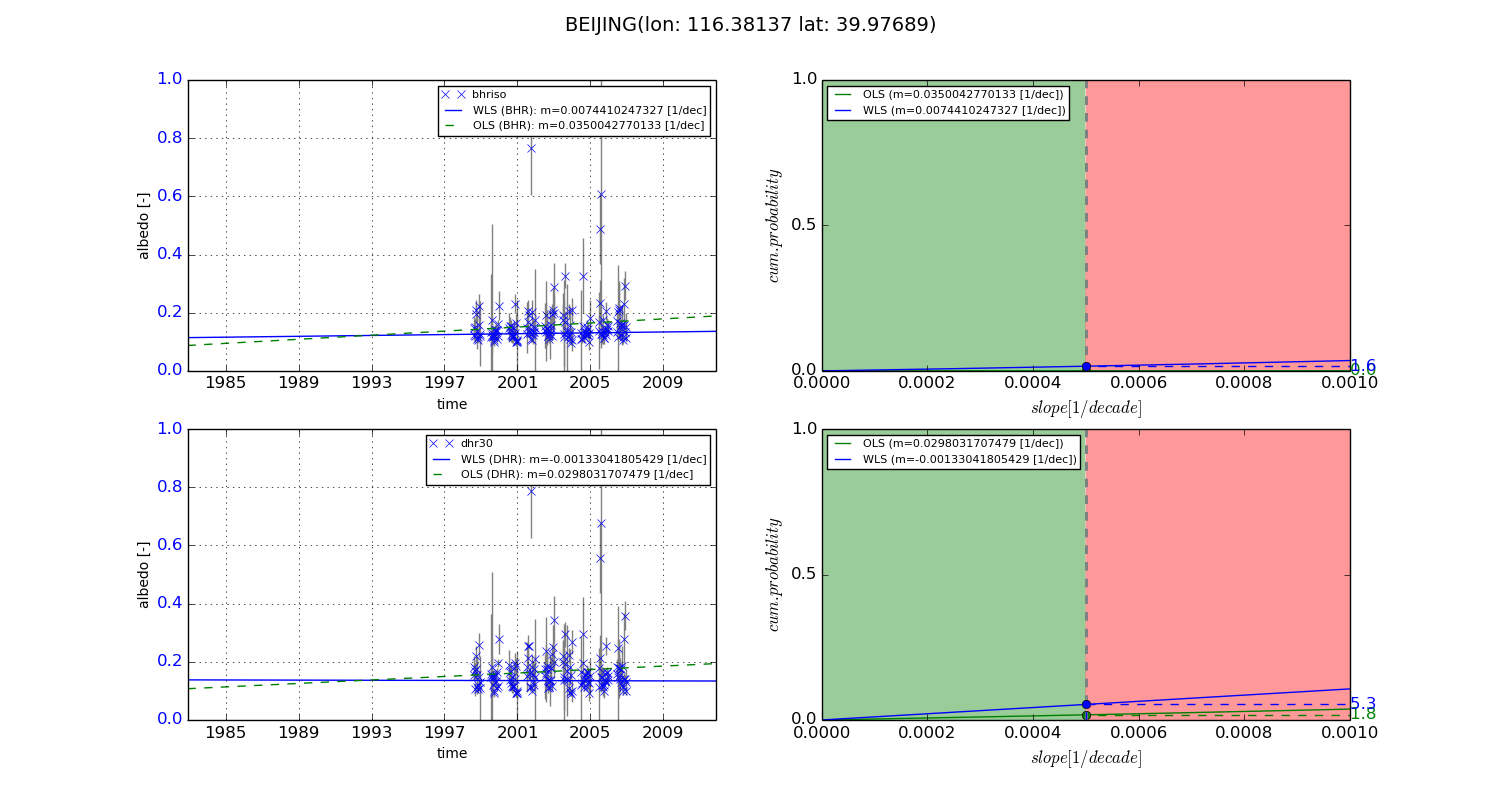
Temporal stability analysis

+000 deg (BHR)


BHR statistics

Temporal stability [1/decade]:


abs

rel


Weighted least square:

None


Ordinary least square:

None


Probabilities that GCOS criteria is met:

Weighted least square:

None %

Ordinary least square:

None %


DHR statistics

Temporal stability [1/decade]:


abs

rel


Weighted least square:

None


Ordinary least square:

None


Probabilities that GCOS criteria is met:

Weighted least square:

None %

Ordinary least square:

None %


+057/+063 deg (BHR)


BHR statistics

Temporal stability [1/decade]:


abs

rel


Weighted least square:

0.0074410247327


Ordinary least square:

0.0350042770133


Probabilities that GCOS criteria is met:

Weighted least square:

1.6 %

Ordinary least square:

0.0 %


DHR statistics

Temporal stability [1/decade]:


abs

rel


Weighted least square:

-0.00133041805429


Ordinary least square:

0.0298031707479


Probabilities that GCOS criteria is met:

Weighted least square:

5.3 %

Ordinary least square:

1.8 %


Temporal anomaly analyis

The variance of the temporal anomalies provides an additional measure about the stability of the signal AFTER removal of the mean seasonal cylce.

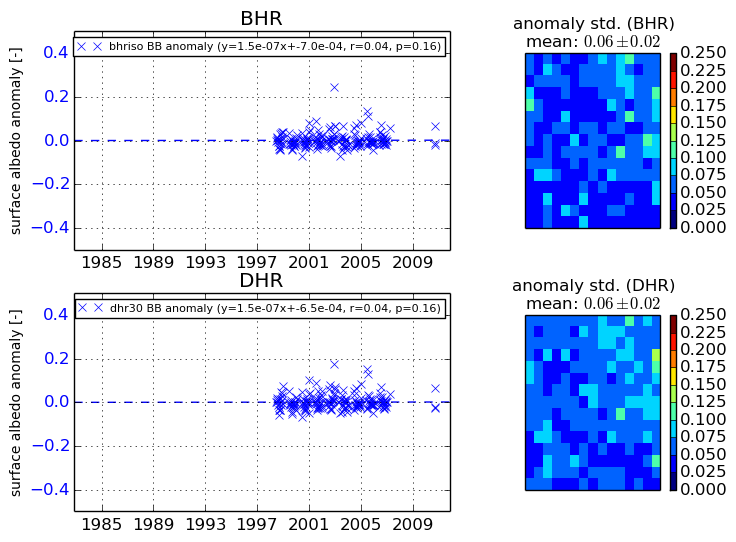
+000 deg


+057/+063 deg