BELMANIP_00005


Location

lon / lat [deg]: -65.6324 / -34.0238

Source network: BELMANIP


Geostationary surface albedo (GSA) data


“+000”


“+057/+063”


Landcover information (based on ESA CCI landcover data)


Landcover fractions @ 2km distance


Landcover fractions @ 20 km distance


Legend


Distance to open water bodies [km]:

3.47

Distance to urban areas [km]:

21.71


Radius: 1 km

Number of landcover classes:

1

Dominant landcover type:

120: Shrubland

Fraction of dominant landcover type [%]:

100.0


Radius: 2 km

Number of landcover classes:

1

Dominant landcover type:

120: Shrubland

Fraction of dominant landcover type [%]:

100.0


Radius: 5 km

Number of landcover classes:

3

Dominant landcover type:

120: Shrubland

Fraction of dominant landcover type [%]:

95.0


Radius: 10 km

Number of landcover classes:

2

Dominant landcover type:

120: Shrubland

Fraction of dominant landcover type [%]:

96.0


Radius: 20 km

Number of landcover classes:

3

Dominant landcover type:

120: Shrubland

Fraction of dominant landcover type [%]:

94.0


Disturbances


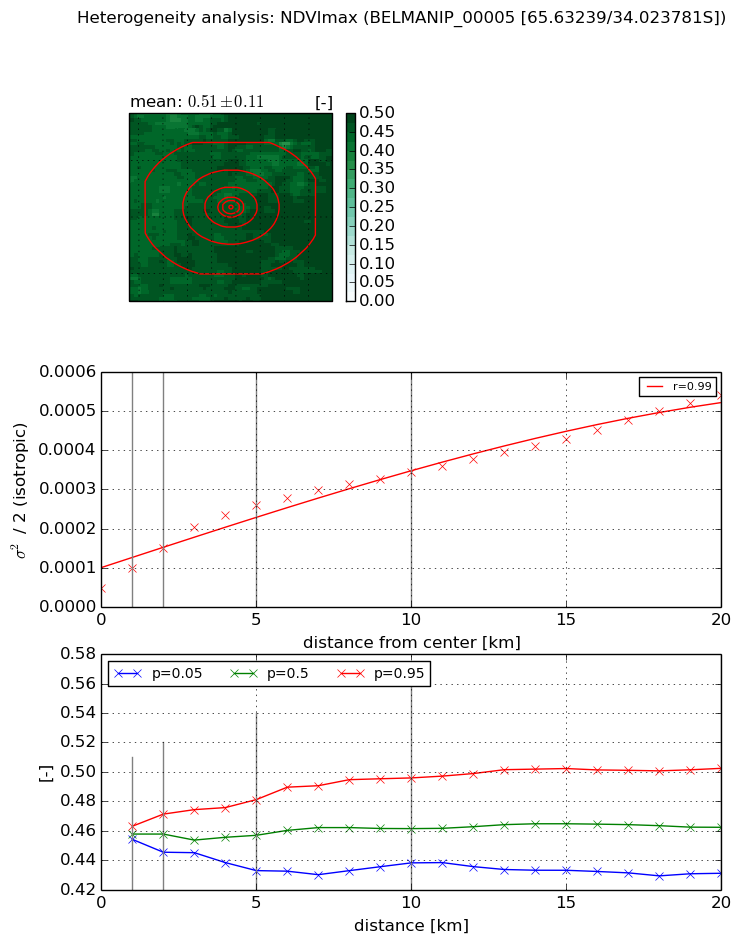
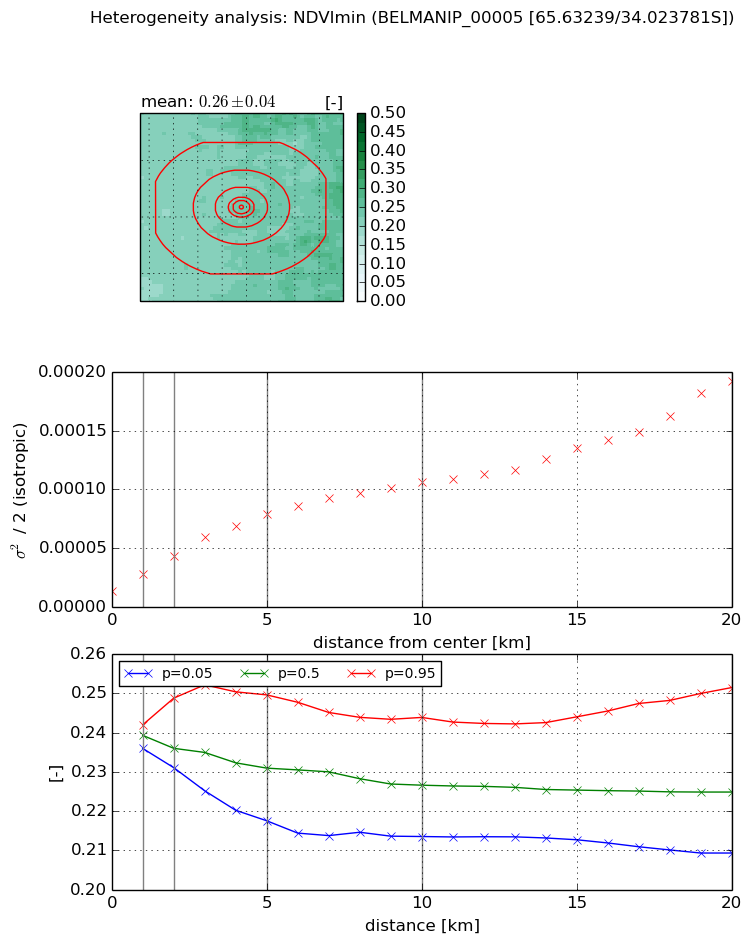
Heterogeneity analysis

The heterogeneity analysis provides information about the spatial and temporal heterogeneity of the site.

Topography


Roman et al. (2009) index


St

1.93045839518

Rcv

0.570085013325

Rse

0.0

Rst

-1.21400123958e-05

Rsv

-0.983937892165


Height range @ 1km [m]

18

Height range @ 2km [m]

16

Height range @ 5km [m]

34

Height range @ 10km [m]

-999

Height range @ 20km [m]

-999


Variance slope @ 1 km

26

Variance slope @ 2 km

16

Variance slope @ 5 km

22

Variance slope @ 10 km

-999

Variance slope @ 20 km

-999


NDVI (max. NDVI composite)


Roman et al. (2009) index


St

1.6400434988

Rcv

0.590920576718

Rse

0.0

Rst

-0.238299321263

Rsv

-0.999999877102


NDVI range @ 1km [-]

0.01

NDVI range @ 2km [-]

0.03

NDVI range @ 5km [-]

0.05

NDVI range @ 10km [-]

0.06

NDVI range @ 20km [-]

0.07


Variance slope @ 1 km

5.10331050513e-05

Variance slope @ 2 km

5.11086469256e-05

Variance slope @ 5 km

4.30965563038e-05

Variance slope @ 10 km

2.81603411454e-05

Variance slope @ 20 km

2.14598936238e-05


NDVI (min. NDVI composite)I


Roman et al. (2009) index


St

6.99831406776

Rcv

0.171529699695

Rse

0.0

Rst

-0.108556133744

Rsv

0.148588840339


NDVI range @ 1km [-]

0.01

NDVI range @ 2km [-]

0.02

NDVI range @ 5km [-]

0.03

NDVI range @ 10km [-]

0.03

NDVI range @ 20km [-]

0.04


NDVI slope @ 1 km

1.44432796634e-05

NDVI slope @ 2 km

1.48175920076e-05

NDVI slope @ 5 km

1.32576017214e-05

NDVI slope @ 10 km

9.05825508765e-06

NDVI slope @ 20 km

7.44088574881e-06


Temporal stability analysis

+000 deg (BHR)


BHR statistics

Temporal stability [1/decade]:


abs

rel


Weighted least square:

-99999.0


Ordinary least square:

-99999.0


Probabilities that GCOS criteria is met:

Weighted least square:

-99999.0 %

Ordinary least square:

-99999.0 %


DHR statistics

Temporal stability [1/decade]:


abs

rel


Weighted least square:

-99999.0


Ordinary least square:

-99999.0


Probabilities that GCOS criteria is met:

Weighted least square:

-99999.0 %

Ordinary least square:

-99999.0 %


+057/+063 deg (BHR)


BHR statistics

Temporal stability [1/decade]:


abs

rel


Weighted least square:

None


Ordinary least square:

None


Probabilities that GCOS criteria is met:

Weighted least square:

None %

Ordinary least square:

None %


DHR statistics

Temporal stability [1/decade]:


abs

rel


Weighted least square:

None


Ordinary least square:

None


Probabilities that GCOS criteria is met:

Weighted least square:

None %

Ordinary least square:

None %


Temporal anomaly analyis

The variance of the temporal anomalies provides an additional measure about the stability of the signal AFTER removal of the mean seasonal cylce.

+000 deg


+057/+063 deg