BELMANIP_00012


Location

lon / lat [deg]: -70.1404 / -25.3275

Source network: BELMANIP


Geostationary surface albedo (GSA) data


“+000”


“+057/+063”


Landcover information (based on ESA CCI landcover data)


Landcover fractions @ 2km distance


Landcover fractions @ 20 km distance


Legend


Distance to open water bodies [km]:

29.7

Distance to urban areas [km]:

30.51


Radius: 1 km

Number of landcover classes:

3

Dominant landcover type:

120: Shrubland

Fraction of dominant landcover type [%]:

58.0


Radius: 2 km

Number of landcover classes:

3

Dominant landcover type:

150: Sparse vegetation (tree, shrub, herbaceous cover) (<15%)

Fraction of dominant landcover type [%]:

52.0


Radius: 5 km

Number of landcover classes:

3

Dominant landcover type:

150: Sparse vegetation (tree, shrub, herbaceous cover) (<15%)

Fraction of dominant landcover type [%]:

60.0


Radius: 10 km

Number of landcover classes:

3

Dominant landcover type:

120: Shrubland

Fraction of dominant landcover type [%]:

43.0


Radius: 20 km

Number of landcover classes:

3

Dominant landcover type:

120: Shrubland

Fraction of dominant landcover type [%]:

38.0


Disturbances


Heterogeneity analysis

The heterogeneity analysis provides information about the spatial and temporal heterogeneity of the site.

Topography


Roman et al. (2009) index


St

1.4199950723

Rcv

0.478512606081

Rse

0.0

Rst

-0.0458108855802

Rsv

1.58835989614


Height range @ 1km [m]

179

Height range @ 2km [m]

219

Height range @ 5km [m]

309

Height range @ 10km [m]

-999

Height range @ 20km [m]

-999


Variance slope @ 1 km

1924

Variance slope @ 2 km

2497

Variance slope @ 5 km

2701

Variance slope @ 10 km

-999

Variance slope @ 20 km

-999


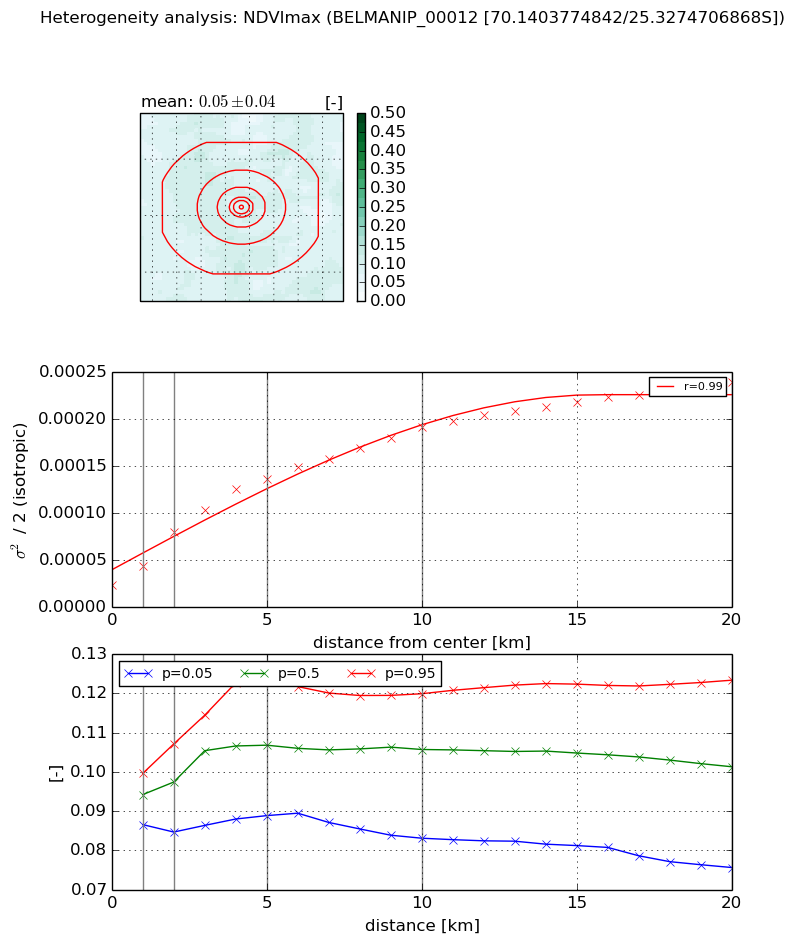
NDVI (max. NDVI composite)


Roman et al. (2009) index


St

3.99772980354

Rcv

0.084047207334

Rse

0.0

Rst

0.295223546233

Rsv

-0.371155149991


NDVI range @ 1km [-]

0.01

NDVI range @ 2km [-]

0.02

NDVI range @ 5km [-]

0.03

NDVI range @ 10km [-]

0.04

NDVI range @ 20km [-]

0.05


Variance slope @ 1 km

2.06257043338e-05

Variance slope @ 2 km

2.84524272149e-05

Variance slope @ 5 km

2.37781905256e-05

Variance slope @ 10 km

1.61694226852e-05

Variance slope @ 20 km

9.6407948065e-06


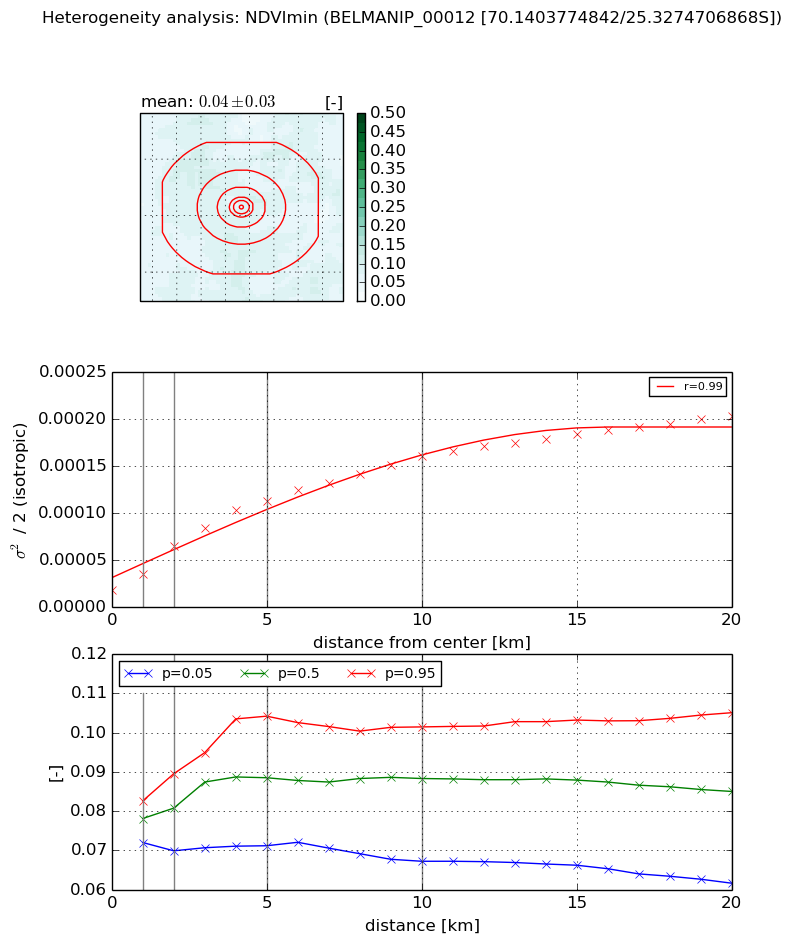
NDVI (min. NDVI composite)I


Roman et al. (2009) index


St

3.10670327002

Rcv

0.106693409897

Rse

0.0

Rst

0.402890935817

Rsv

-0.456069512815


NDVI range @ 1km [-]

0.01

NDVI range @ 2km [-]

0.02

NDVI range @ 5km [-]

0.03

NDVI range @ 10km [-]

0.03

NDVI range @ 20km [-]

0.04


NDVI slope @ 1 km

1.64320864222e-05

NDVI slope @ 2 km

2.31091334517e-05

NDVI slope @ 5 km

1.98871149405e-05

NDVI slope @ 10 km

1.38513254677e-05

NDVI slope @ 20 km

8.33129791731e-06


Temporal stability analysis

+000 deg (BHR)


BHR statistics

Temporal stability [1/decade]:


abs

rel


Weighted least square:

-99999.0


Ordinary least square:

-99999.0


Probabilities that GCOS criteria is met:

Weighted least square:

-99999.0 %

Ordinary least square:

-99999.0 %


DHR statistics

Temporal stability [1/decade]:


abs

rel


Weighted least square:

-99999.0


Ordinary least square:

-99999.0


Probabilities that GCOS criteria is met:

Weighted least square:

-99999.0 %

Ordinary least square:

-99999.0 %


+057/+063 deg (BHR)


BHR statistics

Temporal stability [1/decade]:


abs

rel


Weighted least square:

None


Ordinary least square:

None


Probabilities that GCOS criteria is met:

Weighted least square:

None %

Ordinary least square:

None %


DHR statistics

Temporal stability [1/decade]:


abs

rel


Weighted least square:

None


Ordinary least square:

None


Probabilities that GCOS criteria is met:

Weighted least square:

None %

Ordinary least square:

None %


Temporal anomaly analyis

The variance of the temporal anomalies provides an additional measure about the stability of the signal AFTER removal of the mean seasonal cylce.

+000 deg


+057/+063 deg